Alert fatigue is one of the core reasons why people hate SIEMs. Thankfully, by bringing software engineering principles into security, we can make that better.
In this post, I’ll step through how Detection Engineers think about writing rules that are effective, tested, and actionable. I won’t be covering practical implementations, only concepts that can be applied to any relevant system.
This is the continuation of Part 1, which covered logging. Note: I use the word “detection” and “rule” interchangeably.
Analyzing security data effectively means flagging bad behaviors with a high degree of confidence.
New activity is constantly happening: A user logins into Okta, an EC2 instance is launched, software is installed, websites are visited, a new command is issued, and tons more.
As defenders, we should focus on behaviors relevant to high-risk assets or people. Meaning, what is happening near our crown jewels? In the first post, we covered prioritizing logs that gave us visibility into those assets. As part of a threat modeling exercise, you would map all critical data and services to your organization. This is what we protect and prioritize as Detection Engineers.
When you hear the phrase “needle in the haystack” (cringe), it’s referring to finding the logs that indicate a breach could be happening. In reality, we aren’t aimlessly searching, which is what that analogy suggests. This process happens by filtering data based on various types of indicators, which are broken down nicely by (the appropriately named) “Pyramid of Pain”:
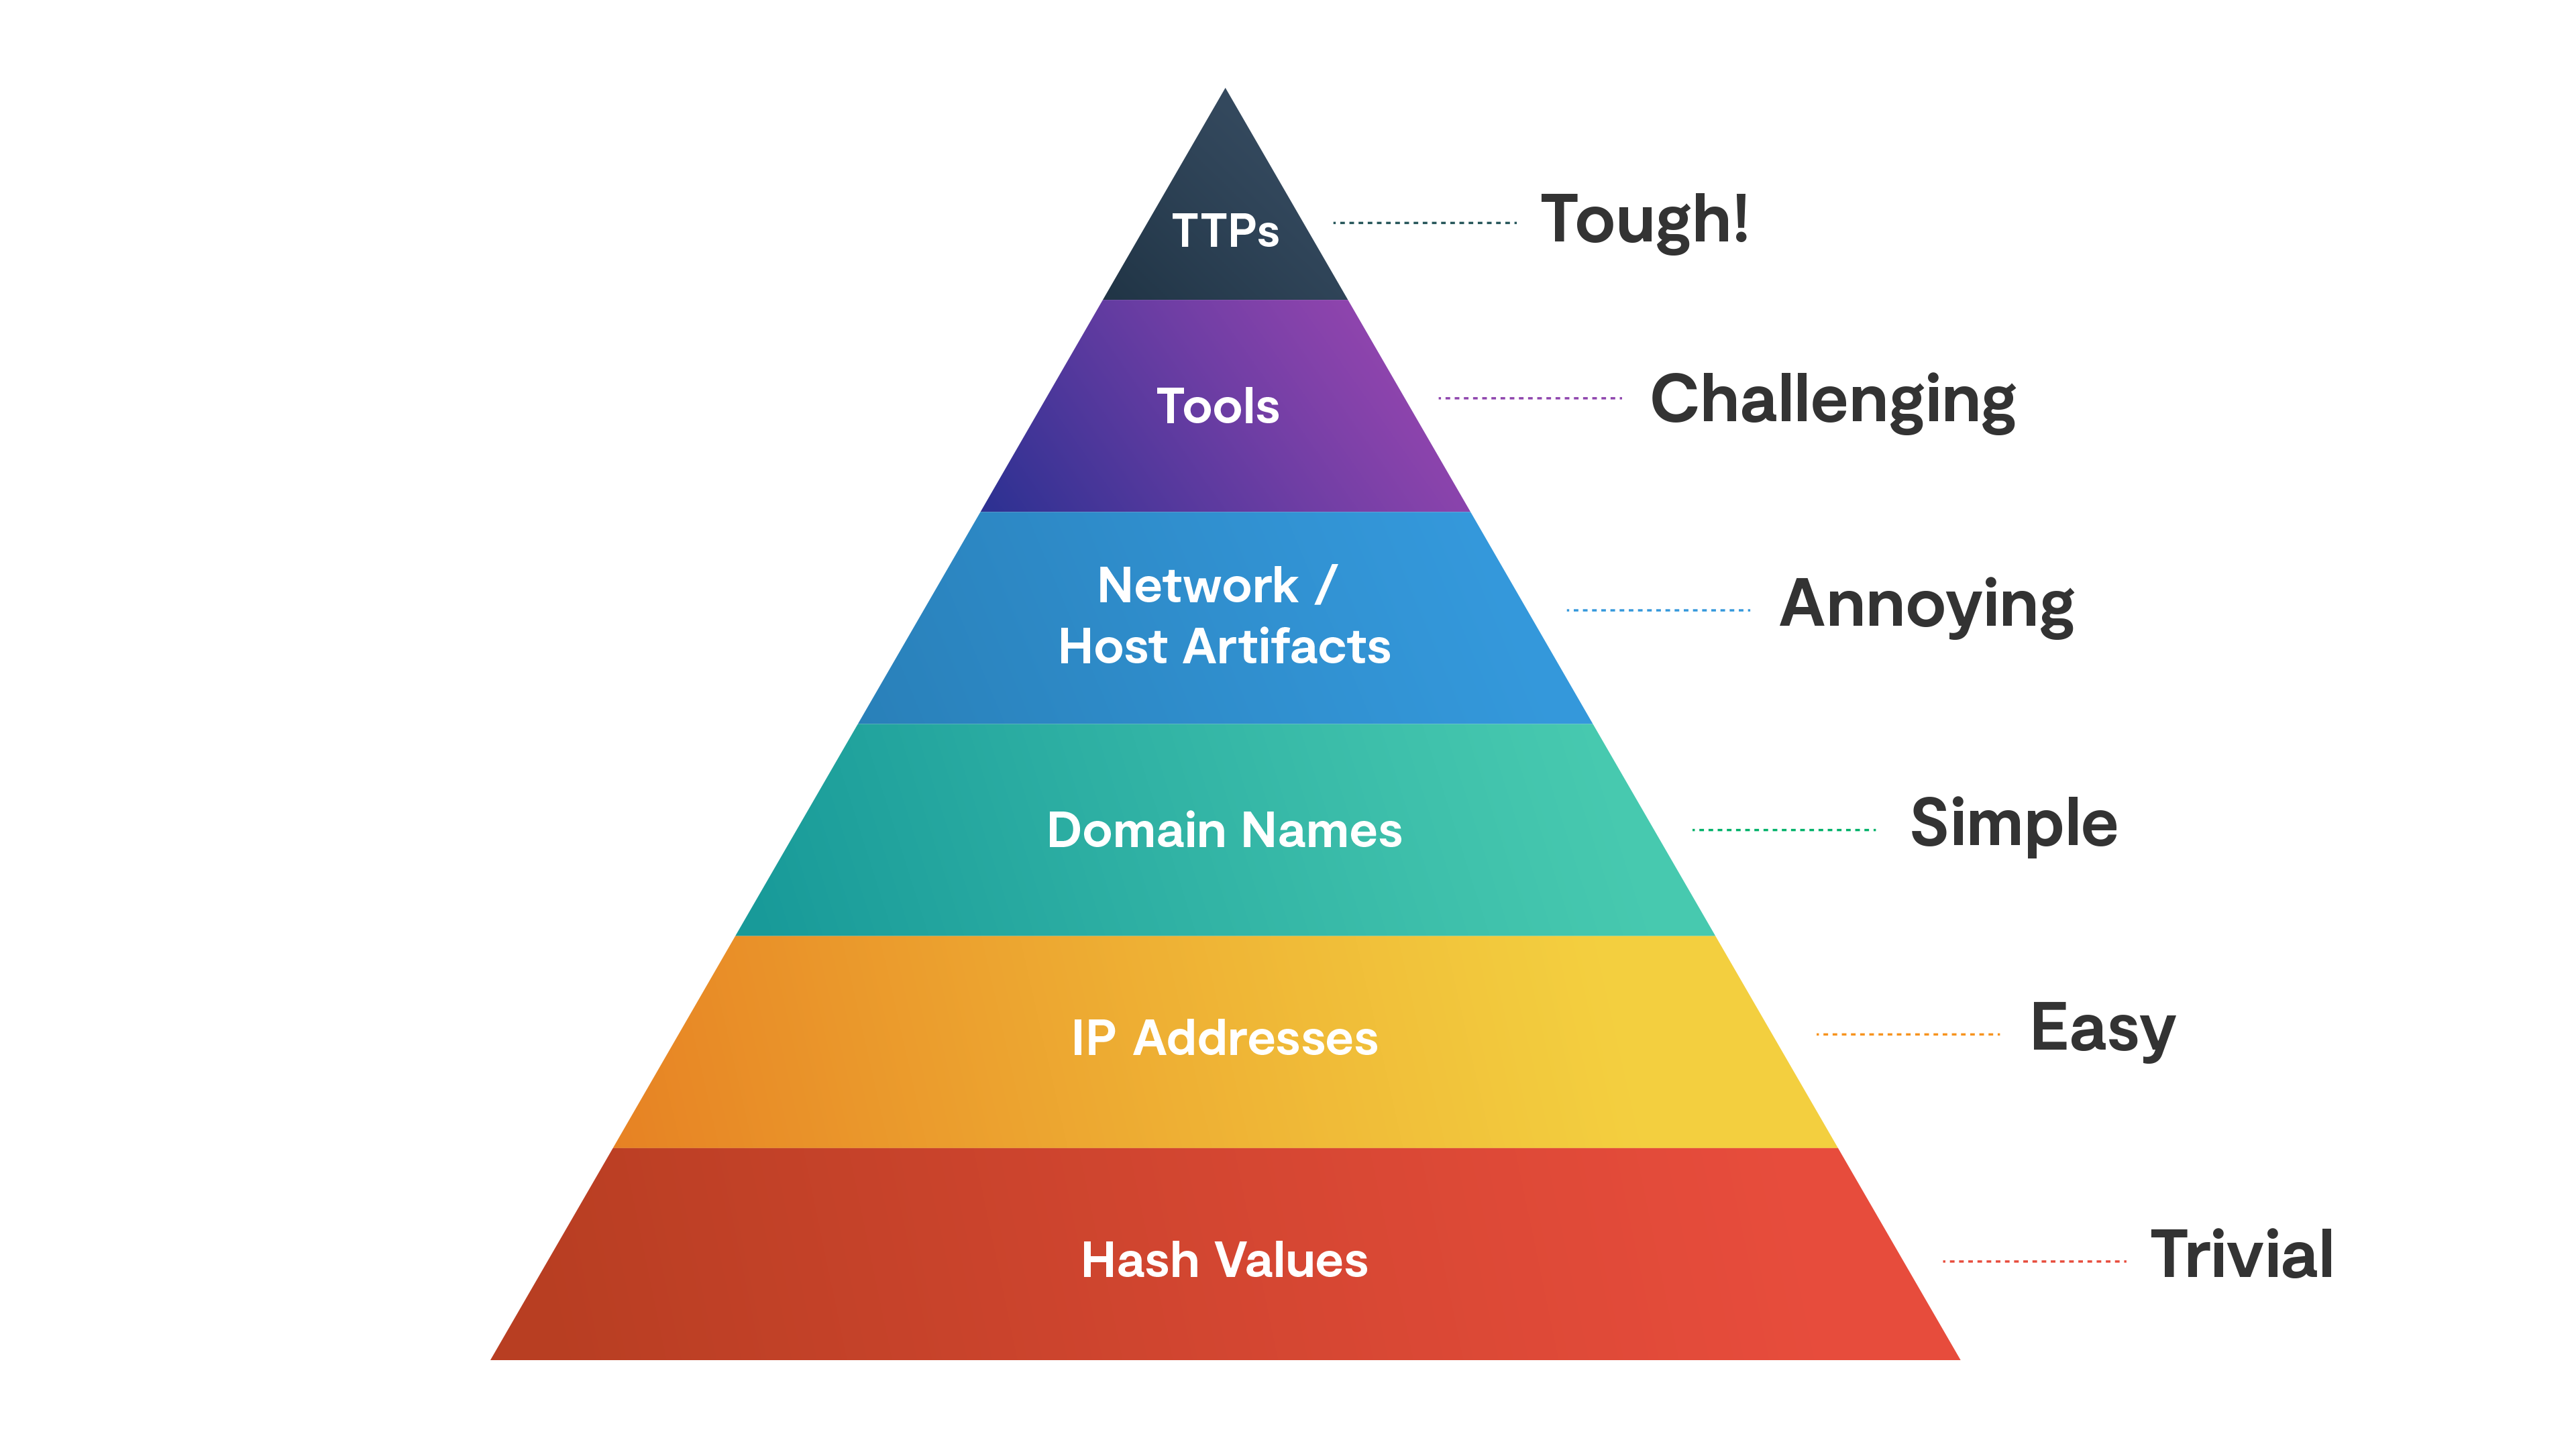
This pyramid associates a higher degree of confidence with alerts generated by indicators at the top of the pyramid. However, flagging atomic indicators like domains, IPs, and hashes on their own tend to be false-positive prone due to their ephemeral nature. As analysts, we’re all tired of chasing down low-fidelity “malicious IPs” to find someone torrenting “Game of Thrones”.
However, if you’ve sourced indicators from a real attack, they are highly valuable for tracking lateral movement, re-emergence of attackers, and building confidence upon behavioral alerts (next point).
The preferred methods of analysis are based on observed attacker techniques, tactics, procedures (TTPs), or usage of adversary tools (Metasploit, etc). An example of a TTP is data exfiltration from an S3 Bucket, a ubiquitous scenario we’re unfortunately too familiar with.
By striving for behavioral analysis, we create a clear path toward taking action.
For example, if a user is accidentally assigned a highly-permissive role (a type of behavior), and we have a rule that flags it, we can remove that access. Similarly, if we detect a malicious cron job created on a host, we can isolate the machine, reset the user credentials, close security group ports, or more.
Again, there’s a pattern of clear behavior along with a path to remediation.
But, if we just see a hit on an IP, we don’t know what to do next, other than find the behavior that triggered the alert by correlating other logs.
That’s why alerts simply based on atomic indicators can be red herrings and often just noise.
I recently held an internal talk about how to detect exfiltration in CloudTrail and S3 Access Logs. Let’s step through the example using pseudocode and example logs and use it for the subsequent concepts in this post.
Data exfiltration in the real world can either happen very slowly or very fast. Typically, the longer an attacker lingers around, the higher probability of being discovered. Let’s assume that an attacker finds an open S3 bucket and quickly tries to steal whatever data they have access to.
To represent this behavior as a rule using AWS logs, we would do something like this:
Sweet, this would result in a rule that’s actionable because we know where to look and how to remediate. But is this rule effective? After all, we want the highest number of true positives. This is where testing comes into play.
How would you test a rule for malicious behavior that’s never happened before?
In software development, engineers write tests to validate their code works as expected. This protects against regression and improves reliability. In security, we can apply these same concepts (with Detection-as-Code) with the purpose of increasing alert efficacy.
Let’s break testing into the following phases:
From Palantir’s ADS framework:
Each alert / detection strategy needs to be tested and refined to remove as many false positives as possible before it is put into production
These phases accomplish just that. Instead of writing a rule and guessing on parameters (should we do 50 events per hour? should we group by IAM role?), we can test it, tune it, and feel good shipping it to production. In the past, we would hope for the best, resulting in broken rules, false positives, and a broken alert lifecycle.
Unit testing ensures that our syntax and detection logic is correct. This works by taking an example log, passing it through the detection, and checking if it generated an alert. There should always be at least one positive (alert) and negative (no alert) case. Depending on the complexity of the rule, you may want more.
Following our S3 exfiltration example above, I would write a negative test (no alert should fire) for erred GetObject events:
{
	"awsRegion": "us-east-1",
	"errorCode": "NoSuchKey",
	"errorMessage": "The specified key does not exist.",
	"eventName": "GetObject",
	"eventSource": "s3.amazonaws.com",
	"eventTime": "2022-05-17 16:28:00",
	"eventType": "AwsApiCall",
	"eventVersion": "1.08",
	"readOnly": true,
	"requestParameters": {
		"Host": "acmecorp-data-100.s3.us-east-1.amazonaws.com",
		"bucketName": "acmecorp-data-100",
		"key": "robots.txt"
	},
	"sourceIPAddress": "12.149.69.18",
	"userAgent": "[aws-cli/2.7.0 Python/3.9.12 Darwin/21.4.0 source/x86_64 prompt/off command/s3api.get-object]",
}Code language: JSON / JSON with Comments (json)
And a negative test for events by an irrelevant AWS service (also should not fire because we care about GetObject events):
{
	"awsRegion": "us-east-2",
	"eventName": "GenerateDataKey",
	"eventSource": "kms.amazonaws.com",
	"eventTime": "2021-05-29 15:32:12",
	"eventType": "AwsApiCall",
	"eventVersion": "1.08",
	"managementEvent": true,
	"readOnly": true,
	"requestID": "24873d89-75f9-4692-993d-bf6e70ec2dd3",
	"sourceIPAddress": "sqs.amazonaws.com",
	"userAgent": "sqs.amazonaws.com",
}Code language: JSON / JSON with Comments (json)
And finally, a positive case checking for the real thing:
{
	"awsRegion": "us-east-1",
	"eventName": "GetObject",
	"eventSource": "s3.amazonaws.com",
	"eventTime": "2022-05-17 16:28:00",
	"eventType": "AwsApiCall",
	"eventVersion": "1.08",
	"readOnly": true,
	"requestParameters": {
		"Host": "acmecorp-data-100.s3.us-east-1.amazonaws.com",
		"bucketName": "acmecorp-data-100",
		"key": "cc-data"
	},
	"sourceIPAddress": "12.149.69.18",
	"userAgent": "[aws-cli/2.7.0 Python/3.9.12 Darwin/21.4.0 source/x86_64 prompt/off command/s3api.get-object]",
}Code language: JSON / JSON with Comments (json)
These are our baseline checks that will stay with the rule through various changes in its lifecycle. Over time, the tests ensure we don’t lose sight of the initial goal of this detection.
The next step is to backtest our detection, or, run it against historical data. This answers the question “how many alerts would have been generated from the last X days of data?”. If the answer is, too many, then you’ll need to tune the rule or make it more specific. Oftentimes, this means adding enrichment sources that add context to the data.
This could also mean honing in on a smaller subset of data that more accurately represents the behavior you care about by attaching more filters.
With the advent of modern, cloud data warehouses (like Snowflake and Databricks), we can retain data much longer than what was possible in the past (Petabytes vs Terabytes). This is great for Detection-as-Code because we can improve our accuracy by having a richer set of data at our disposal. Security is a data problem, after all.
Almost there! Now that we’ve pre-tuned our detection, let’s get it running on real data. This is what “staging” is used for.
Typically, staging environments receive either a copy or a subset of production traffic. In detection engineering, this can be achieved by flipping a detection into a “monitoring mode” where no alerts will actually be dispatched to our team, yet.
Teams will leave new detections (or changes to existing ones) to bake for a few days, or up to a week. This way, enough data passes through the detection to have confidence that you haven’t built a ticket cannon, and this is an additional layer of confidence over the backtesting and unit testing.
The last step is flipping the switch and shipping our tuned, behavioral-based detection to production. Now our team (or automation pipelines) will get real alerts that improve our overall detection posture.
The hope at this point is that we’ve done a good job of creating a detection that’s well-tested, resulting in true-positive alerts.
This process gets rinsed and repeated until our threat model is covered.
The text of an alert should be an obvious one-liner:
IAM User [jack_naglieri] downloaded 500 objects from bucket [acmecorp-data-100] in account [prod]Code language: Shell Session (shell)This alert gives me a good place to start. We know the actor (who), the behavior (what), and the related cloud account and entities (where). And because we tested this rule and mapped it to our threat models, we know that this is behavior that we don’t condone.
36 threat intelligence hits on IP [119.148.10.158]Code language: Shell Session (shell)Which only gives me an atomic indicator. I don’t know what this IP did, and therefore have a difficult time gauging how much emphasis to place.
Tip: Try to include as many of the 5 W’s (and 1 H) in your alerts. Your team will thank you.
With higher confidence in alerts comes the potential to take automated actions. While this deserves an entire blog post, I want to clarify the relationship between SOAR and SIEM with regard to alert actionability.
SOARs shouldn’t validate alerts. The SIEM should have all the context necessary, and therefore only send high-confidence alerts to the SOAR.
SOARs are not designed (or priced) for high-volume and should be only used when we are absolutely ready to take complex, orchestrated actions that resolve alerts and save analysts time in manual steps. Good SOARs help teams focus on less-trivial security work, just like good SIEMs reduce the overhead in ingesting, analyzing, and investigating data.
There are scenarios where non-actionable alerts are appropriate. In compliance, we need to prove that controls and monitoring work as advertised, which means siphoning a subset of data into a corner for quick retrieval later on.
This materializes into monitoring permissive role usage, logging administrative commands run on production systems, or other noisy behaviors that we would never want to get synchronous alerts for.
Down the line, these informational rules are very useful for quickly answering compliance questions, instead of needing to crawl over the data again. I recommend writing rules that send quiet alerts for this purpose.
The future of security is characterized by incorporating lessons from software engineering and applying them to detection engineering. This looks less like ad-hoc IP querying and more like automated analysis doing the work for us with higher fidelity.
No one type of detection is perfect, but keeping an actionability mindset coupled with various levels of testing can raise our accuracy more over time, and combine signals in the right way to get toward 100%.