Writing Your First Python Detection in 30 Minutes with Okta and Panther
Ken
Westin
Dec 19, 2022
One of the challenges of the legacy approach to SIEM is the cost and time it takes to get the infrastructure set up and running before you can even start writing detections. These legacy platforms also require you to learn proprietary languages that take even more time. This post will walk you through how to ingest data and set up a detection in under 30 minutes using a language you probably already know Python.
As more companies rely on an increasingly distributed remote workforce, identity has become a key target of cybercriminals through phishing, compromised credentials on the dark web, brute force, or other methods. As we have seen recently, more than multi-factor authentication (MFA) is needed to stop the most persistent attackers. You may remember the recent threat group Lapsus$ who were able to compromise high-impact targets with low-tech methods by targeting employee identities. We will use Okta as our data source to identify common and more sophisticated attacks in our example.
Free as in Beer
To get started, you sign up for a free trial of Panther. The free trial will enable you to get up and running swiftly with detection-as-code and onboard data to see how those detections are operationalized at scale. In addition to the Panther free trial instance, we will leverage the free developer account offered by Okta to test our detection in the wild with actual data (Panther also has sample Okta data available for building detections and testing).
A Panther Cubs First Detection
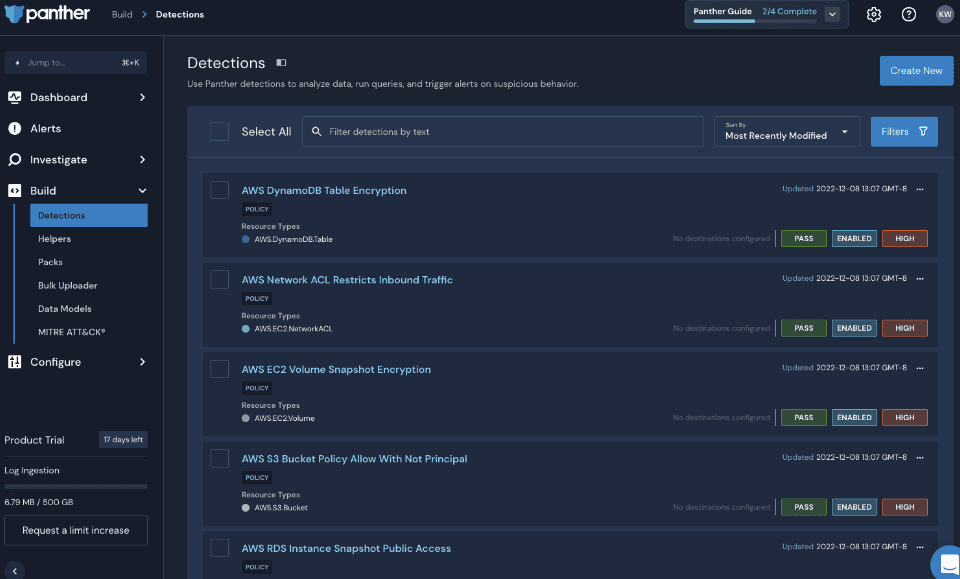
We will write a basic detection that identifies multiple failed logins, prioritize the alert based on user role, as well as establish thresholds and aggregation to reduce alert volume. Before we onboard data, we can start working with detections immediately. Lets navigate to Build -> Detections.
You will see that Panther comes with many detections out-of-the-box; you can enable these in the Packs menu and can either use them as is or modify/replicate them as you see fit. I recommend exploring these detections; they can be used as is, or as building blocks for your own custom detections.
According to the 2022 Verizon DBIR report, compromised credentials have been one of the organizations biggest threats and accounted for nearly 50% of all attacks in 2022. When it comes to detecting potentially compromised credentials, it isnt one-size-fits-all. Every organization is unique in how they approach this threat and requires flexibility to customize the detection for its needs. We will start with writing a detection for potential credential stuffing using Okta as our data source. To begin writing our first detection in Python, click Create New in the upper right corner.
In the Name field, type Okta Failed Login Test for the severity, select MEDIUM, and for Log Type, type in Okta, and you should see a checkbox next to Okta.System.Log.
Now we will create the detection and tests by clicking on the Functions & Tests tab, where we will write our first detection in Python. You can copy and paste this code into the code box. This short bit of code is importing a Panther helper function called deep_get, which makes it easier to access nested parameters in the JSON of the log file. This library has many powerful helper functions to make writing detection more effortless and faster. Every detection in Panther requires the rule() process; here, we have a simple rule that looks for an authentication event that is a failure that will return true to trigger an alert.
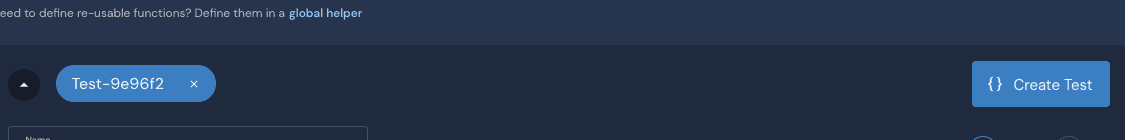
Now we also want to be able to test the function; click on the Create Test button to open the data input window.
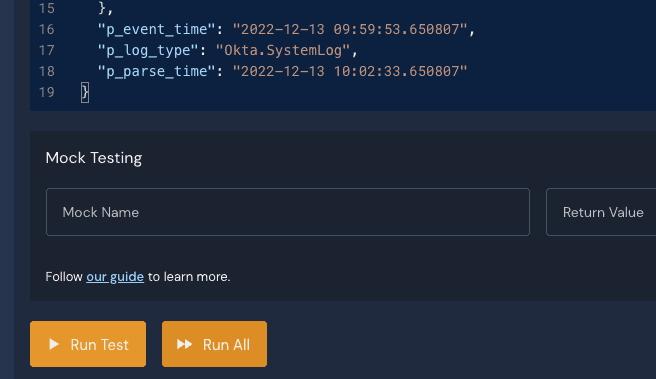
In this window we will want to copy and paste this JSON sample:
So we now have sample data that we can apply to our detection rule. We can click the Run Test button to run quick tests.
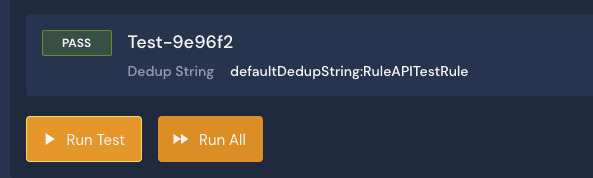
When you run the test, you should see a Pass result; if there are any syntax or other errors, they will appear here instead. Congratulations, you just wrote your first detection in Panther!
Context Matters
This alert is a good start, but as you can imagine, this rule will generate a lot of alerts, and we also need to provide more context concerning what triggered the alert. Lets give some thresholds and context to the alert by leveraging additional Panther functions in our detection logic.
First, I have added the severity() function, which allows me to adjust the severity of the alert depending on various parameters; in this example, if the detection involves an administrator account, I set the severity to CRITICAL, if the account is associated with a developer test account the severity is assessed to INFO. Then any other account, the severity is set to MEDIUM. To provide more context on the alert, I use the title() function to provide a customized title and specifics regarding the impacted account. The last function I use is the dedup() function so that I dont get a slew of alerts from logins of the same IP address; this allows me to group them into one alert.
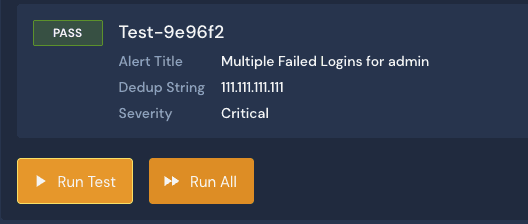
When I run my test, I have more context on the alert. I have a unique title that provides context regarding the account impacted, the source IP address of the login event, and the severity set to Critical, as the test sample has admin listed as the user impacted.
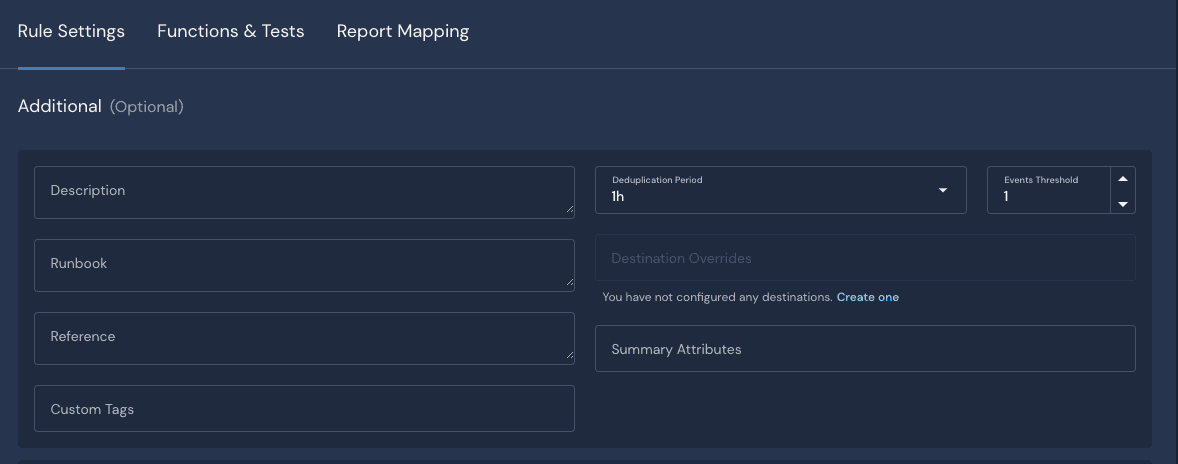
Further Refinement
In addition to customizing a detection in Python, additional parameters are available to us to tune the rule in the Rule Settings tab. To help reduce the number of alerts, we can set the deduplication period and the number of events that trigger the signal. In this case, I am putting it to 1-hour intervals.
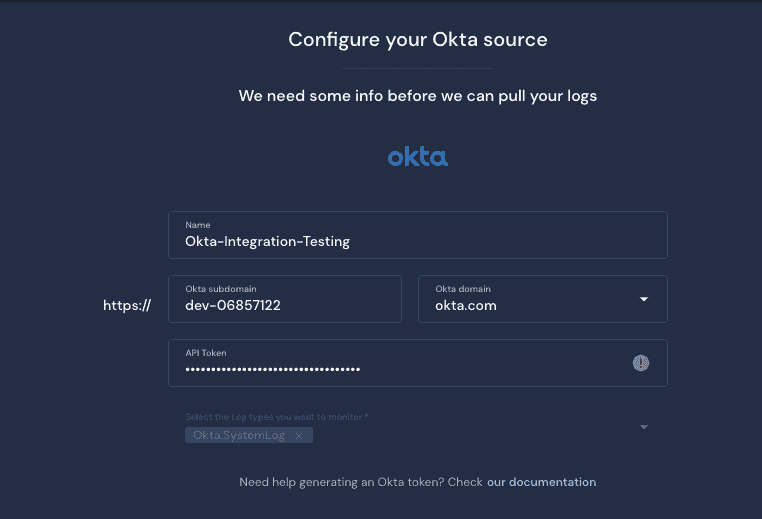
Data Onboarding
The onboarding of data in legacy SIEMs can be time-consuming to manage the ingest pipeline, manage schemas and prepare the data before writing detections in a proprietary query language. In Panther, we can quickly and efficiently onboard SaaS data sources in minutes. We have written a detection and were able to test it without onboarding data rapidly. To onboard data, we will use a free Okta free developer account for our testing. Once you have access to your free Okta developer account, you can follow the documentation to generate your API key. You can also onboard data from a production Okta account if you want to see how your detections operate at scale.
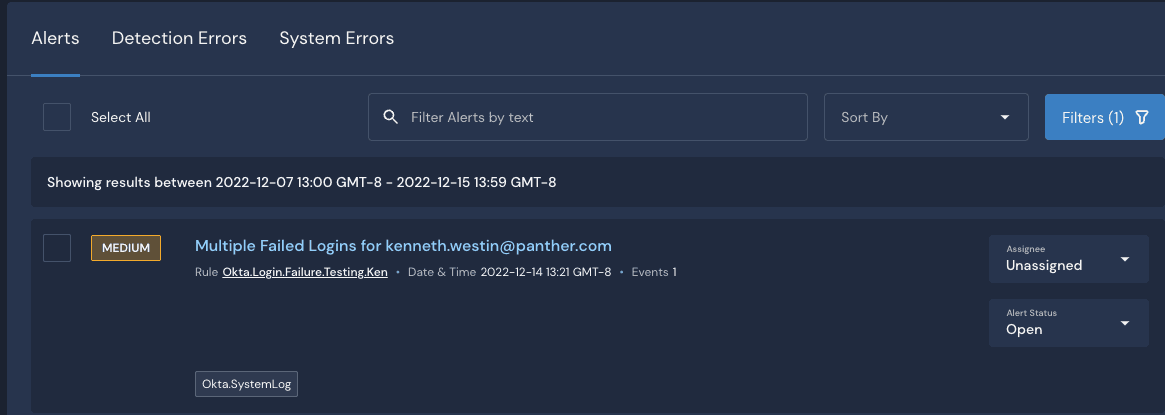
Now with live data being ingested, we can test our detection for real. If you attempt multiple failed logins that match the thresholds you set, you should now see your MEDIUM severity alert appear on the Alerts screen.
Summary
In this blog post, we covered quite a bit to get you up and running with Panther, but we have only scratched the surface of what the platform can do. In this example, we built a real-time detection that will be triggered as data flows through the Panther platform. In the coming weeks, I will write another blog post on leveraging the platform to run retroactive searches, sequence recognition, and threat hunting for compromised credential scenarios in the Panther Security Data Lake using another common language SQL.
As a next step, look at the Panther Quick Start Guide and documentation and sign up for one of our detection-as-code workshops to dig deeper and get more hands-on exploring Panther.
Share: