An outage of 104 services within Amazon Web Services (AWS) on June 13, 2023 in the us-east-1 region affected a large number of internet services, including Panther. As a company deeply ingrained with AWS and reliant on several of its services, we were directly impacted. However, thanks to the foresight of our engineering team, our highly-instrumented system, and our sturdy architecture, we were able to weather this storm and ensure no data loss for our customers.
One of our engineering ethos is to provide a system that can scale automatically to the needs of our users, without the need for human intervention. This stems directly from our customers’ needs – the ability to send us a wide variety of volumes of data, all throughout the day and night. Our architecture leans heavily on AWS Lambda, Amazon Simple Queue Service (SQS), and Amazon S3, forming a well-integrated sturdy system to process, analyze, and alert users of security detections in real-time.
At the heart of our operations is AWS Lambda, a serverless computing service we use to process data. This service enables us to run our code without provisioning or managing servers, giving us the flexibility to expand dynamically according to the demands of our system. AWS Lambda’s seamless integration with SQS forms the backbone of our data-handling process. The separation of compute and storage isn’t a new concept, but it’s one Panther fully embraces. But what lies in the middle of this equation? For us, it’s Amazon SQS, a reliable and scalable middleman.
While Panther supports many different ways to get data into our systems, almost all of it ends up on some SQS queue after getting through our front doors. Amazon SQS is essential for buffering our data. It’s a fully managed message queuing service that decouples and scales distributed systems, ensuring that our Lambda functions receive a steady stream of data for processing. In our system, every queue is backed by a Dead Letter Queue (DLQ). In the context of messaging systems, a DLQ is a queue that other source queues can target for messages that are not successfully processed. This approach ensures no data is lost in the process, enhancing our system’s resilience.
Both processed and unprocessed data and is stored in Amazon S3 buckets, a scalable object storage service, for staging and backup purposes. Buffered by SQS queues, data is processed by Lambda services. Post-processing, the data is stored back into S3, ready for later use, and piped to our long-term storage in Snowflake for further analysis. This consistent cycle of data flow — S3 to SQS to Lambda and back to S3 — enables us to maintain a high throughput of data processing, which is vital for real-time alerting.
Beyond these core services, we use a variety of other AWS tools to further augment our system’s ability to cater to the ever-increasing data volume needs of our customers, as well as Snowflake for long-term data storage and analysis.
Furthermore, Panther is designed as a regional service, meaning issues in one region only impact customers operating within that region. With this approach, we effectively isolate and minimize the impact of region-specific incidents. This strategy is a deliberate choice, made to reinforce the dependability of our service.
When AWS Lambda went down in us-east-1, we were immediately notified through our telemetry data. We saw the massive drop in Lambda invocations and were also able to tell right away this was isolated only to a single region. AWS Lambda was operating at reduced capacity for nearly 3 hours. To help visualize the effect on our system, we have a few charts that provide a snapshot of what occurred during the outage from our point of view.
First, let’s look at the number of Lambda invocations per region. As shown in chart 1, invocations in the us-east-1 region dropped down to near zero. This essentially meant that our compute engine, the heart of our data processing pipeline, came to a sudden halt in this region. Panic ensues.
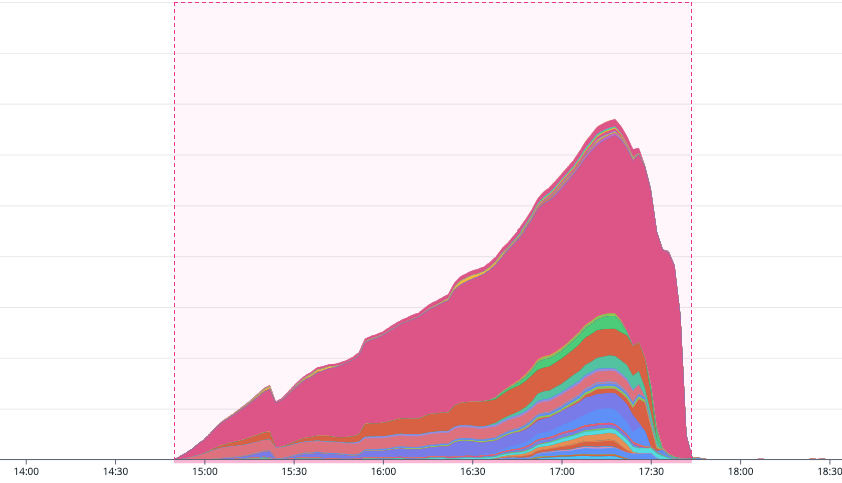
However, the data didn’t stop coming in. We rely on several other services to get data into our platform, where it eventually ends up in our SQS queues. This leads us to our second chart, depicting the growth in our SQS queues. The queues, acting as our data buffer, started filling up rapidly. This is a clear illustration of how our system’s resilience measures kicked in: even with Lambda out of commission, our data was not lost; instead, it was held safely in SQS, waiting to be processed. Slightly less panicked.
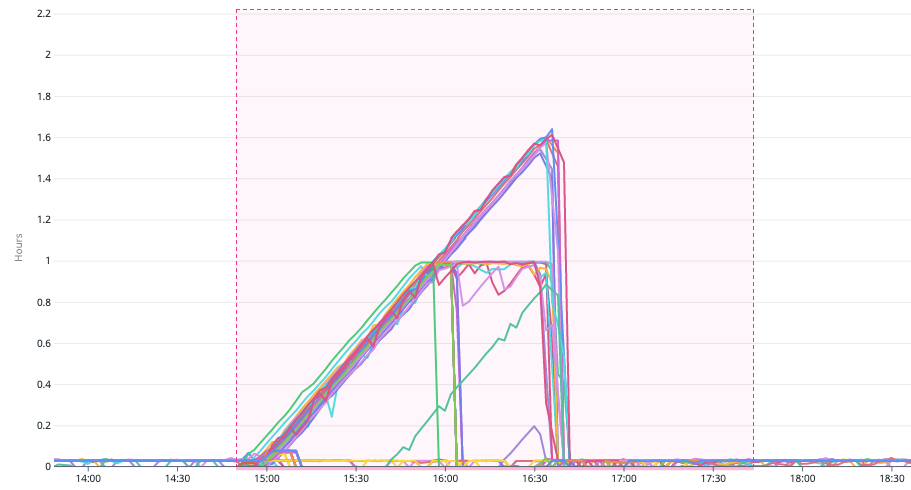
Our third chart showcases the Lambda Max Iterator Age. This ‘Iterator Age’ metric represents the ‘age’ of the most recent record processed from a data stream. It measures the duration from when the data stream initially receives a particular record to the moment when the event source mapping finally sends that record off to be processed by the function. Essentially, this metric gives us an indication of how long a record sits in the queue or stream before being processed, acting as a good measure of latency in the data processing pipeline. While SQS isn’t the only data stream source we read from, as the outage persisted, this iterator age increased significantly. This indicated that our data was waiting longer to be processed, as it was held up in the growing SQS queues due to the Lambda functions being unavailable.
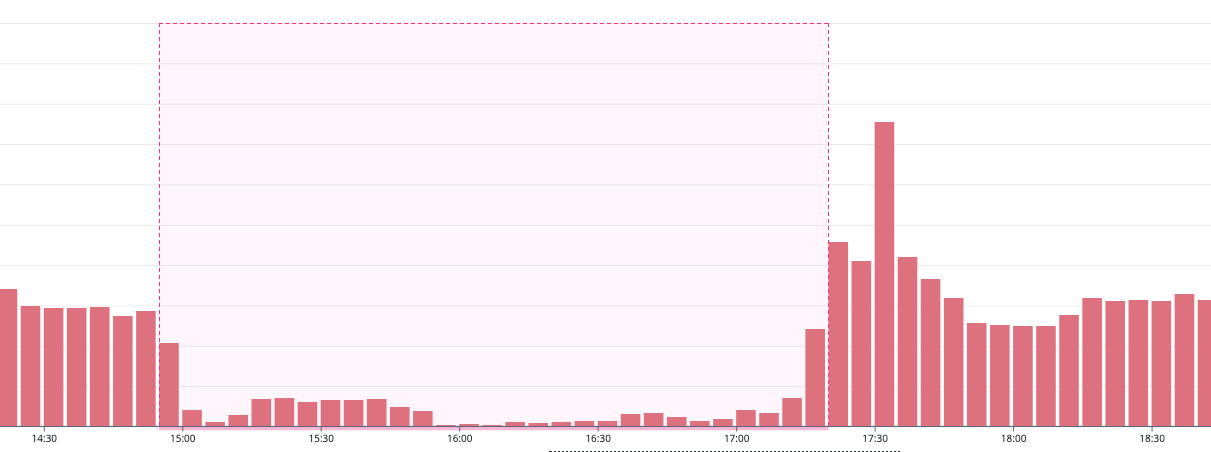
The fourth chart shows the number of requests to S3 Buckets in the us-east-1 region dropped significantly. Without our Lambdas processing data, they were not writing data either. We see some requests still being made by our other services.
These charts highlight the crucial role SQS played during this time and gave our on-call engineers some peace of mind while the region was down. Despite Lambda service going offline, the robustness of our system design ensured that we didn’t lose any data, with SQS queues accommodating the increased load. It’s worth noting that while this situation was far from routine, our system was designed to handle such contingencies, ensuring minimal impact on our customers even under unexpected circumstances.
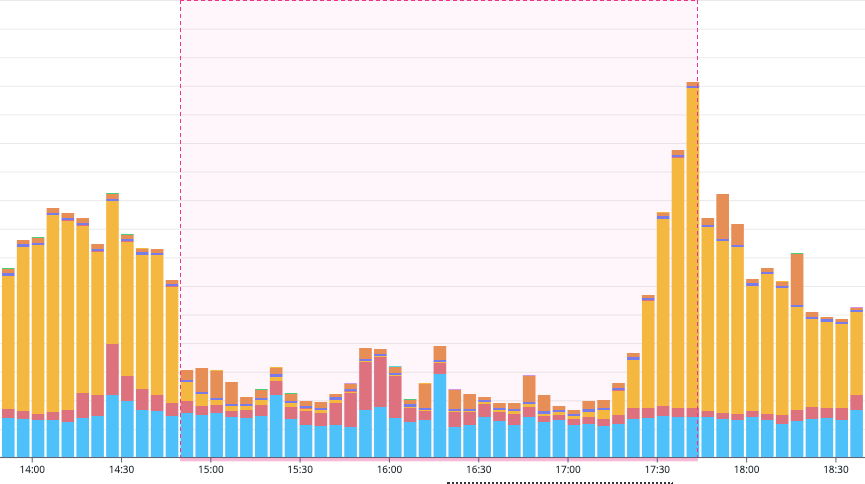
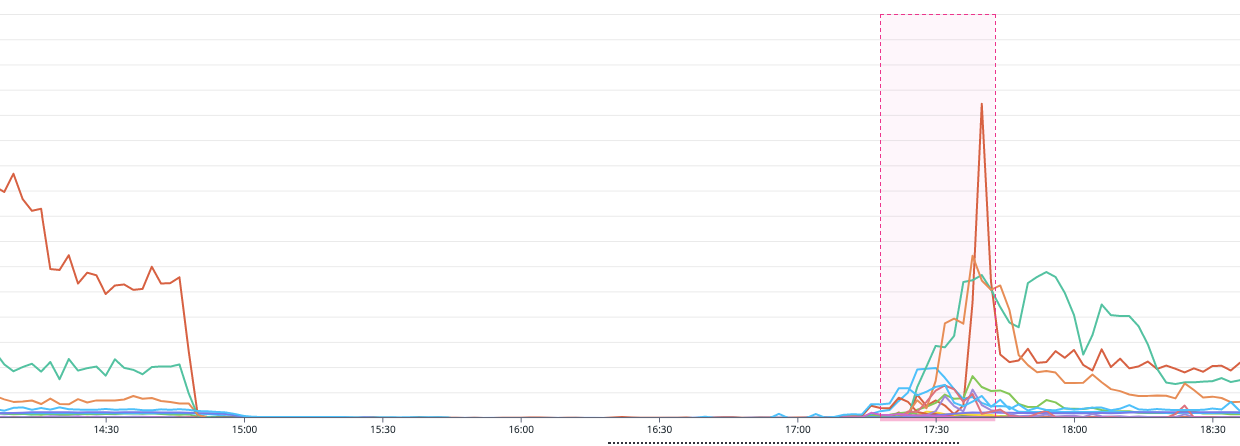
The outage served as an unplanned, yet effective stress test for our infrastructure. While vigilantly monitoring the AWS status page and our system dashboards, we were keenly anticipating signs of recovery. The first indication of this recovery came in the form of a substantial surge in Lambda executions once the service was restored. As shown in chart 5, Lambda invocations escalated to hundreds of thousands within a brief recovery period. This escalation was not just a response; it was our system’s automated resilience kicking into action. Without the need for manual intervention, the accumulated data in the SQS queues was processed due to our system’s inherent auto-scaling capabilities.
As we began to see the signs of recovery, our focus shifted to our Lambda concurrency dashboards to watch the system scale effortlessly. As predicted and shown in chart 6, we saw a substantial increase in concurrent executions across all the Lambdas in the region. The focus here isn’t on the threat of throttling from too many concurrent invocations, but rather a demonstration of our system’s capability to scale horizontally. In our operations, throttling is commonly seen as a positive aspect. Throttling supports our systems in methodically recovering by distributing load evenly like an intelligence pressure valve.
This sudden data surge was easily absorbed by our infrastructure. The beauty of this architecture lies in its ability to maintain this volume of data at any time. Essentially, we could have sustained these peaks indefinitely, a testament to our engineers’ hard work over the years.
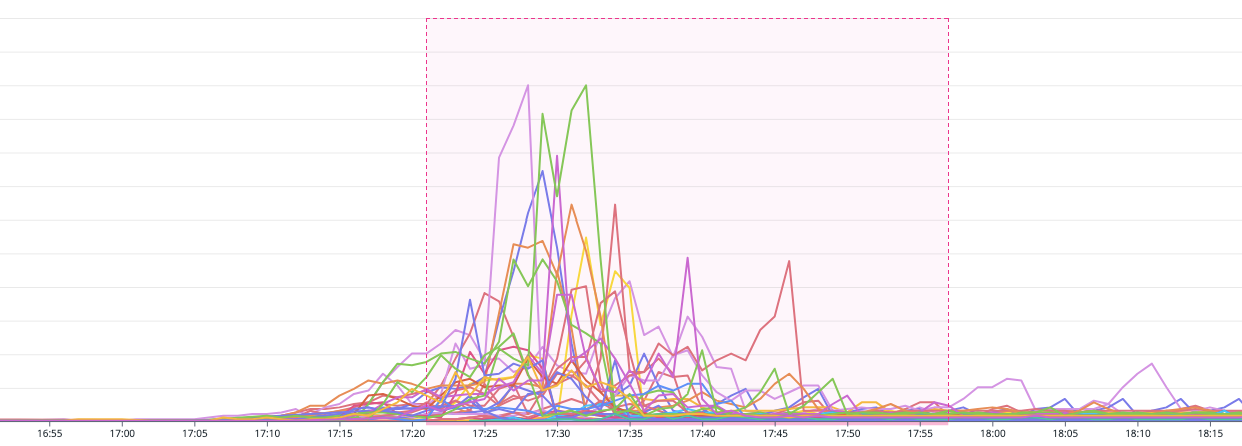
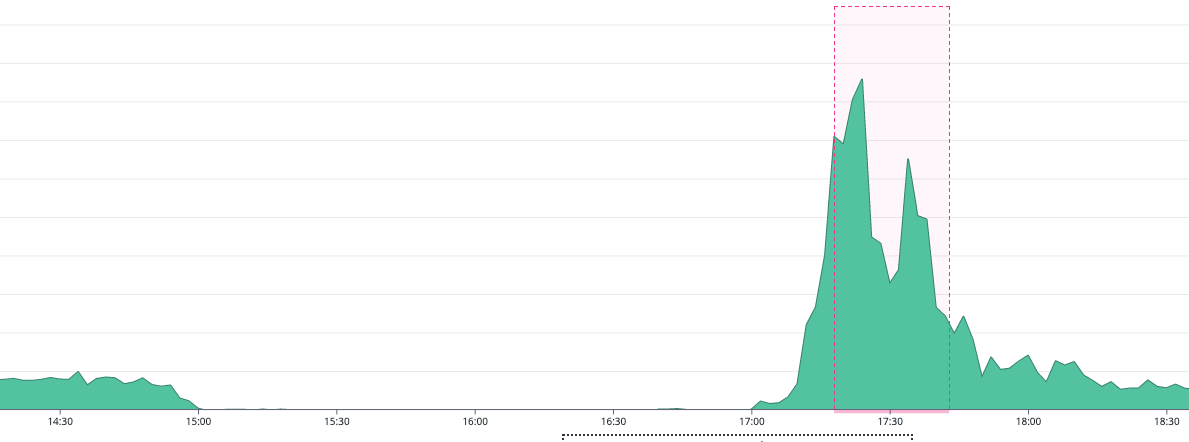
Chart 7 captures the essence of our system’s design philosophy – to scale automatically and efficiently, adapting to the needs of the moment. As soon as Lambda was back online, our system rapidly scaled up its processing capabilities to accommodate the buffered data in the SQS queues.
Throughout this outage and subsequent recovery, our engineers could focus on monitoring the situation, rather than scrambling to implement manual recovery strategies. Our system’s built-in self-optimization allowed us to ride out the Lambda outage with minimal impact on our customer’s data, and then rapidly process the accumulated data once Lambda was back online.
This outage highlighted the resiliency of our system but also identified areas that could potentially be improved. One significant observation was the volume of on-call notifications, a small alert storm. While this noise was stressful for some, our instrumentation and dashboards gave some peace of mind. During our postmortem, we were able to reassess many alerts, tune thresholds, and continue to improve the on-call experience for our engineers. Being on-call shouldn’t mean being constantly interrupted by unimportant signals. Instead, our aim is to continuously improve this system where our engineers are notified of critical failures, and let the resiliency of our system handle the rest. As such, we’re working to continue to focus on symptom-based alerts rather than cause-based ones.
This incident demonstrated the real-world effectiveness of our system’s design philosophy – a commitment to automatic scalability, system resilience, and data integrity. It underscored our dedication to ensuring uninterrupted, reliable service to our customers, even in the face of unexpected service disruptions. The steadfastness displayed by our platform during this outage is the culmination of years of diligent and disciplined engineering. With any incident, we’re reminded that system resilience is not a sudden achievement, but an iterative process and a result of continuous care efforts over time. Our pride in the system’s performance is immense, and we regard it as validation of our ongoing dedication to our engineering ethos.