With the massive expansion of SaaS adoption over the last decade, there has been an explosion of data for security teams to manage. One of the primary providers enabling this widespread cloud adoption is Microsoft Azure.
Being one of the established “Big 3” cloud providers, Azure accounts for a 22% market share and has a growing adoption of roughly 40% annually. In order to accommodate the security teams implementing any of the many Microsoft or Azure services, Panther has added support for the Microsoft Graph API.
In this blog, we’ll discuss the different Azure and Microsoft services that Panther can integrate with through the Graph API.
Panther can now integrate with the Microsoft Graph API which can be used to obtain security alerts from the following Microsoft & Azure security products below:
The following data sources have pre-built schema created in the Panther product. Once the API is integrated, logs can be automatically parsed, normalized, and enriched as they’re streamed into Panther. Users can then create detections to apply to logs in real time and get alerts within minutes.
Sample alerts from these services include
Let’s take a look at how we can take one of these alerts and create an additional context to it in Panther.
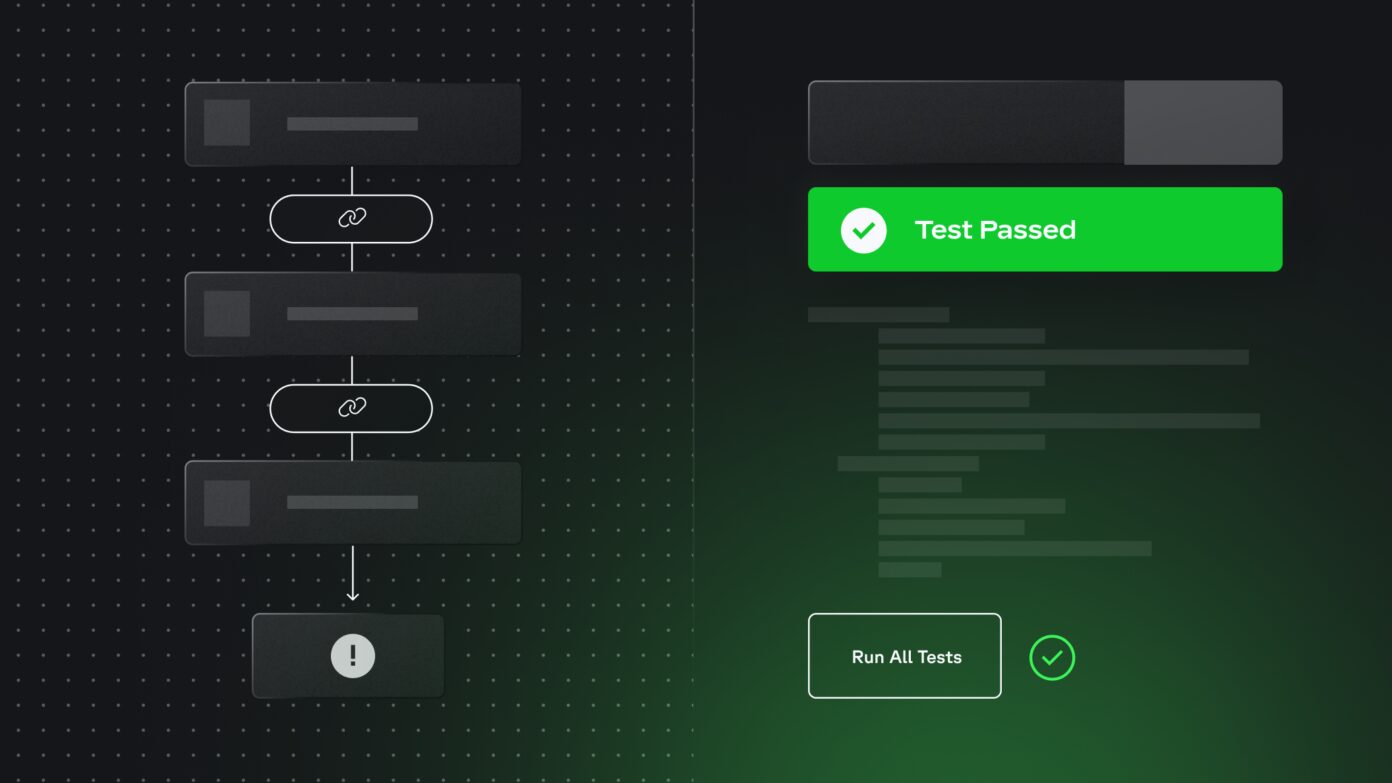
Let’s take a specific example of an alert from Microsoft Defender for Identity, that signals when a suspected identity theft (pass-the-hash) is being attempted. The alert is generated in Microsoft and pulled into Panther. Panther parses, normalizes, and enriches the data to include the addition of p_fields. These fields standardize all log sources so that they’re searchable all at once.
Once the alert is generated, you can use indicator search to run an IoC-based investigation, searching to see if the IP address associated with the Microsoft Defender alert had been involved in other services across the organization’s environment.
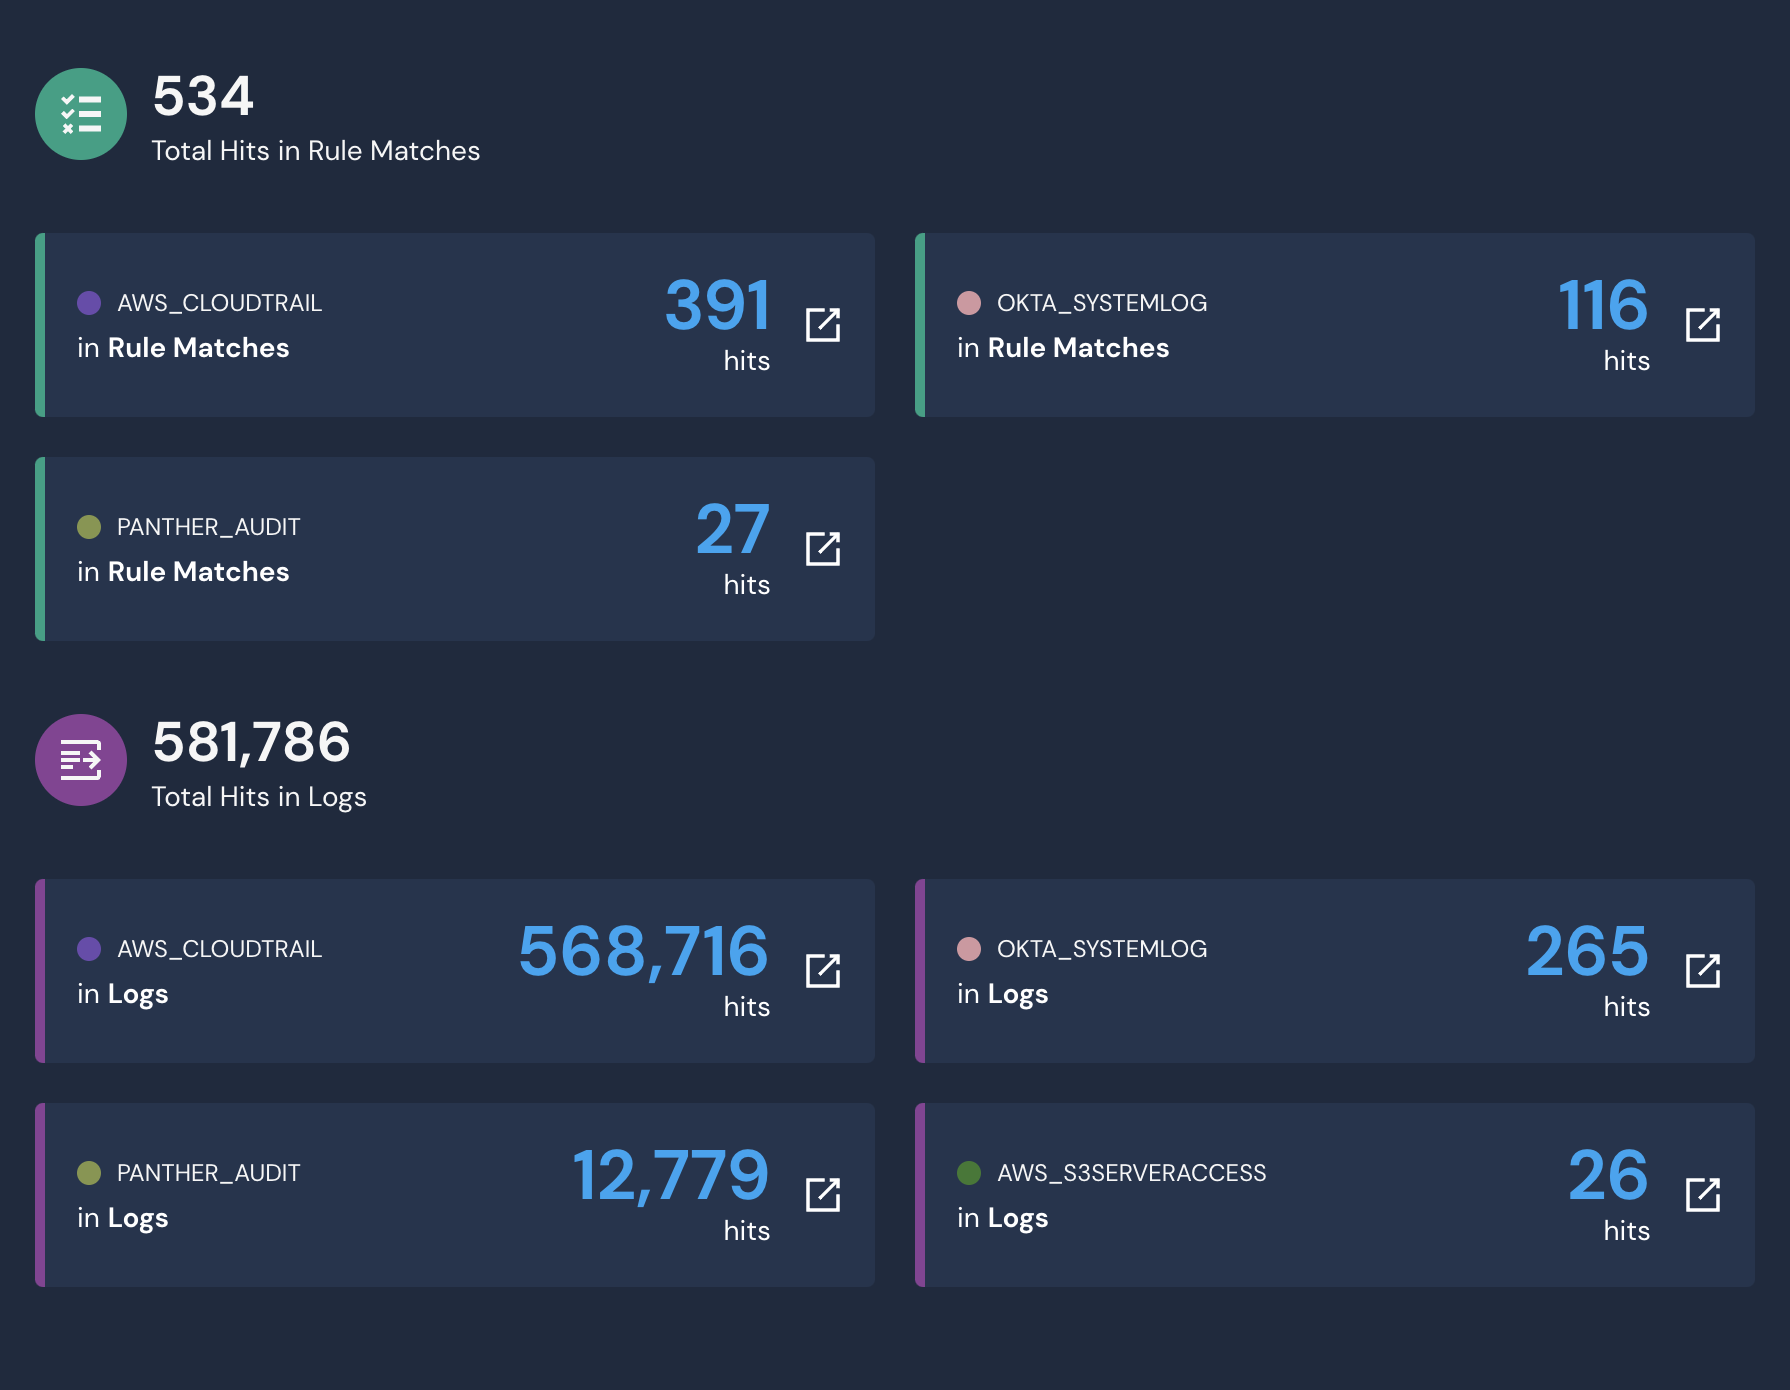
With the search, you can now see the rule matches and log hits, where the IP has been detected, in other services outside of Microsoft. Seeing that there are a large number of rule matches in our Okta system logs, you can further pivot your investigation by digging into the individual event logs in the data explorer. By simply selecting one of the boxes above, a SQL query will be generated.
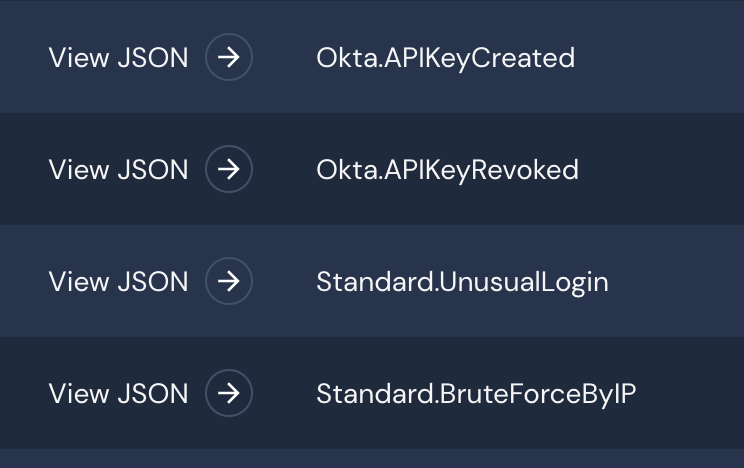
Once the data is queried, you can filter to see the respective alerts that have been triggered by the suspected IP address. Seeing that an API key has been created by the IP, you can assume that credentials have been compromised and begin locking down the respective accounts.
In a matter of minutes, you’re able to receive the initial alert, correlate it with the rest of your data, and then analyze the suspected intruder within other applications and services in your environment. This gives you a complete understanding of the potential threats in minutes.
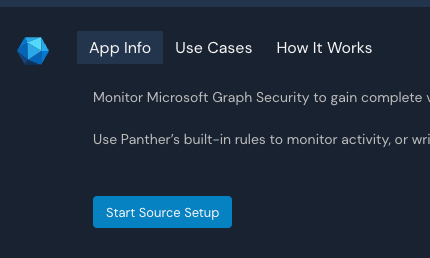
In order to get started with integrating the Microsoft Graph API with Panther, login to your Panther console and navigate to Configure > Log Sources > Create New. Under “Services List with built-in support” find the Microsoft Graph logo.
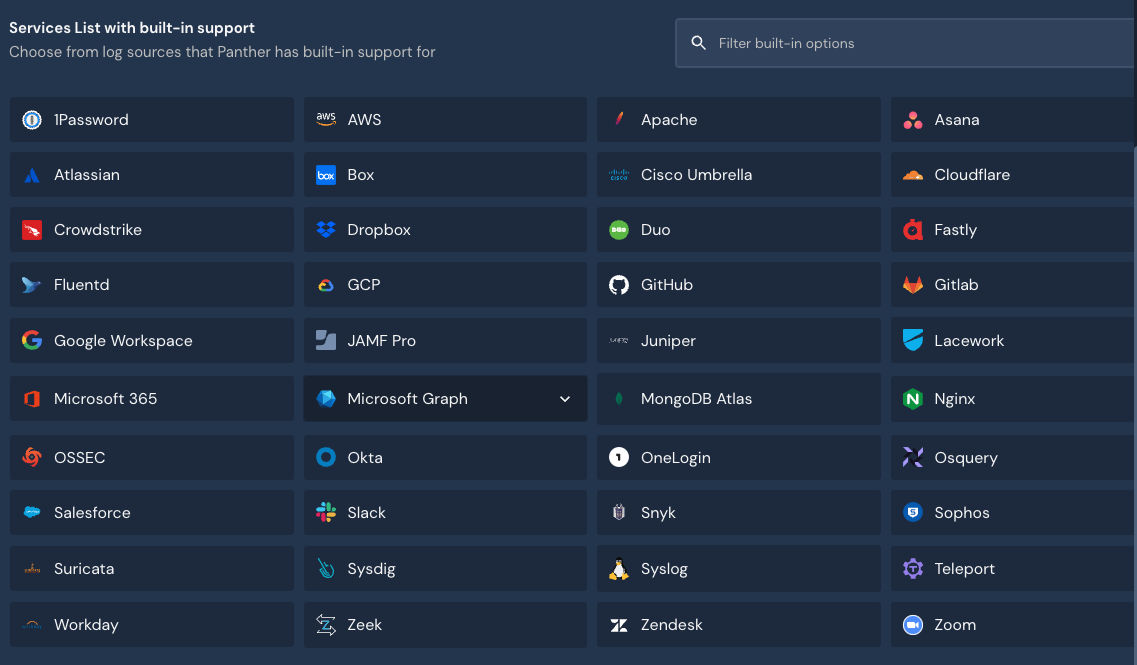
Once found, select “Start Source Setup”
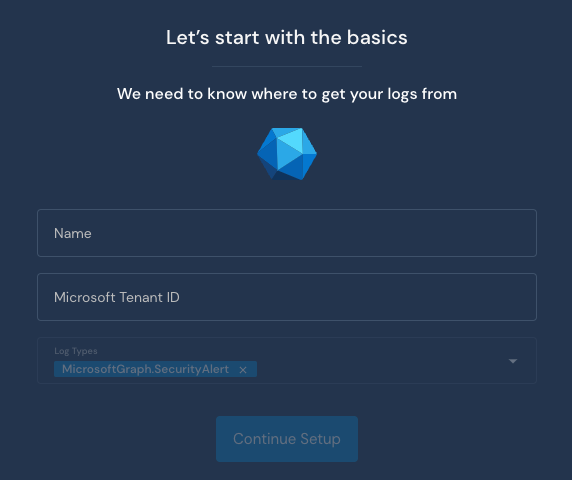
Enter in a unique name for the integration along with your Microsoft Tenant ID (this can be generated from Azure AD)
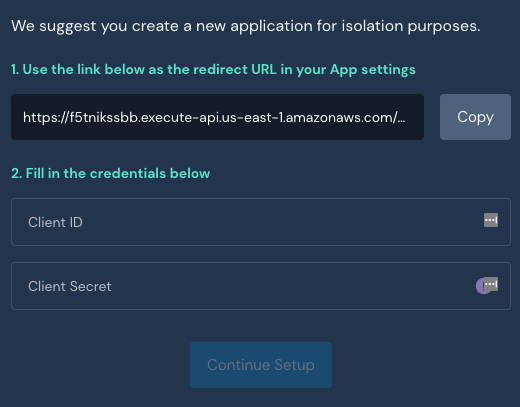
The next screen will provide you a redirect link that should be shared in Azure AD. Then lastly provide your Client ID and Client Secret from Azure AD.
Once done, the integration is completed. You should start seeing events streamed into Panther in a few minutes. Now that logs are streamed into Panther, let’s look at examples of what we can do with the incoming data.
With the ability to set up Panther in under an hour, security teams have immediate access to add coverage of their Azure and Microsoft tools in minutes. Our platform provides teams with more detection coverage, development efficiency, and accuracy with alerts, and can also lead to significant reductions in the total cost of ownership.