BLOG
Enrichment Baselines: A Statistical Framework for Threat Detection
Zaynah
Smith-DaSilva
Overview
In the age of creative malicious actors, it is vital to combat them by utilizing intuitive new detection types. Enrichment baselines are integral in establishing a normal picture of behavior across your environment (e.g. typical activity from a given user, service, or resource over a period of time). What separates anomaly detection from threshold based detection is the ability to observe patterns of behavior over time to detect anomalies rather than static detections alerting on arbitrary values such as exceeding a certain threshold. Utilizing baselines allows for higher-fidelity detections with fewer false positives, and adaptable detections that rely less on frequent tuning.
Baselines are tables containing information regarding a users’ typical metrics over a long period of time (e.g 90 days) such as country, city, ip address, and device. Separate z-score queries are run every 6 hours that compare the past 7 days of activity against the baseline tables to check for deviations from a users’ usual activity that could be indicative of anomalous behavior.
Static detections are beneficial for detecting a specific kind of event that can apply to everyone regardless of history. For example, a static detection could easily detect an admin creation event or login without MFA used. However, when it comes to more complex event series over time, this is where baseline detections excel. They are able to take in contextual information for a given user over a period of time to determine if activity appears anomalous or not in relation to their typical behaviors. A perfect example of this includes a user authenticating from countries in rapid succession that they have never accessed from before.
Enrichment baselines unlock AI-assisted triage. AI agents can rapidly and efficiently triage incoming alerts by contextualizing the anomaly against the baseline. AI agents can determine how far the activity deviates from the norm, how long the pattern has occurred, and if similar detections have been triggered prior. Panther AI also provides the ability to map out an entire story regarding the threat activity detected from baselines, providing analysts with a clear and concise picture. Analysts are provided with a richer starting point as the AI agent contextualizes the data and allows AI triage to move quicker and with higher confidence.
A realistic real world scenario where baselines shine includes an Okta AD Agent theft. In this instance, an attacker exfiltrates an Okta AD Agent token from a compromised server and begins replaying it from their infrastructure across multiple IP addresses simultaneously. The victim user normally authenticates from a single corporate IP at a steady rate. The AD Agent z-score query detects a volume spike 4 standard deviations above the user’s mean, combined with IP diversity jumping from 1 to 7 distinct IPs in a single hour. Neither threshold alone would catch this but together; they fire the anomaly flag. Static detections would fail to detect this kind of incident as they do not have profiles to go off of when determining what constitutes abnormal behavior.
This methodology allows for statistically based anomaly detection as we move away from static detections. Baseline detections are imperative to keep up with the evolving threat landscape.
Detection Capabilities Offered by Panther
1. Detect Okta AD Agent Token Theft and Abuse
Token theft is typically represented by stolen credentials used from varying IPs and geographic locations in rapid succession. The detection identifies this pattern and triggers alerts accordingly. This detection performs mean and standard deviation calculations for hourly authentication volume, IP diversity, country diversity, and device diversity. Upon recent activity showing both a volume spike and a geographic/IP diversity spike, an alert triggers.
2. Detect Okta Authentication Bypass via Skeleton Key Injection
This detection checks for security weakening actions and admin enrollments that could hint at Skeleton Key Injection. A significant spike in security weakening policy changes and admin policy changes from a user triggers this detection. Skeleton key attacks involve authentication policy manipulation as a means to weaken MFA requirements. Following this, attacker-controlled authenticators are enrolled on victim accounts. This detection detects this activity by building a 90 day baseline on the admin policy changes and factor enrollment patterns for a given user, then checking for anomalous spikes within the past 7 days.
3. Okta SWA Bulk Credential Extraction Detection
This detects Okta SWA (Secure Web Authentication) bulk credential extraction, abuse, and access from unknown IP addresses or user agents. SWA credential access involves a malicious actor with admin access being able to move laterally and compromise hundreds of SWA applications without needing MFA. This detection utilizes a 90 day behavioral baseline for each admin’s SWA access, credential change patterns and known source IPs/user agents. From this, anomalous spikes within the last 7 days are detected and alerted upon.
4. Okta SWA Off-Hours Password Access Detection
This detects Okta SWA credential access outside of normal business hours through the use of z-score analysis on temporal patterns. Accessing SWA applications at abnormal times of the day and from varying geographic locations can be indicative of anomalous activity such as a compromised admin account. This detection builds a 90 day baseline for each admin’s temporal credential access patterns. The detection identifies any anomalous shifts (off-hours, late-night, and weekend activity) within the past 7 days and alerts accordingly.
Baselines Structure
Baselines are structured into two primary phases. In the first phase, a baseline builder query runs and is populated with the users’ routine activity patterns and behavioral indicators. The baseline builder explicitly excludes the most recent 7 days of data to avoid contaminating the baseline with attacks that may be ongoing. In the second phase, a series of z -score queries are executed against the data retrieved from the initial baseline builder query. These z -score queries are used to aid their corresponding detections in determining if anomalous activity is at play or not. High z-scores across fields that hit the detection threshold trigger an alert whereas normal activity is disregarded.
Baseline Builders
Okta Baseline 90d
The baseline builder query for the Okta Baseline 90d lookup table is a general baseline query for all Okta users that also incorporates event-specific statistical baselines for detections.
General Section - 90 Day Baseline (All Event Types)
The general section includes all of the Okta events within the past 90 days. This section includes scalar features such as volume, diversity counts, temporal ratios, and security patterns. It also includes distribution features such as country, IP, hour, app, browser, OS, ASN, and MFA factor. In this lookup table, the primary key is the user email.
Scalar Features
The scalar features (Common Table Expression) CTE provides distinct values per user in a single row summary aggregated across the 90 days period. Features include categories such as volume metrics (total event count, active days), outcome ratios (success rate), diversity counts (distinct countries, cities, browsers, etc.), temporal ratios (weekdays vs. weekends), network behavior indicators (proxy and tunnel usage), values mapping user’s regular activity patterns, and integrated Okta risk markers including new device detections and anomalous activity.
By establishing distinct values that are normal for the user, that information can form z-score queries to flag potentially anomalous diversity spikes. An example of this includes a user who typically authenticates from one country, suddenly authenticating from seven new ones within a short time period. Ultimately, establishing a user’s normal activity and statistics aids in finding deviations later on.
Distribution Features
Distribution features allocate a full frequency profile per user. This CTE constructs a key-value map of each value and their respective event counts. An example of this is a country_distribution field for a user that looks as follows $\{$ “US”: 847, “CA”: 12, “DE”: 3$\}$. This showcases how many times each value is triggered by a user, so in this case it shows how many times a user authenticated from each given country. This information is extremely vital for z-score detections as it showcases how often a user triggered a given value. Identifying dominant values triggered by a user helps identify regular activity versus potentially anomalous activity. For example, a user authenticating from a given country 800 times would be read as dominant activity whereas a rarely seen country would at first ring suspicions. This functionality is integral for anomaly detection as regular versus abnormal activity can be easily mapped and referenced.
VPN Features
The VPN CTE compiles a user’s historical VPN usage. Three dimensions of VPN usage are captured by joining against the tunnel_features sub-query which flattens Okta’s debug Context.debugData.tunnels array. The three dimensions comprise of the following:
Presence & Volume: Vpn_uses_vpn is a boolean flag that indicates whether or not the user has ever authenticated through a VPN within the baseline time period. Vpn_events_count is a raw count of VPN-tunneled events which establishes normal frequency Provider Profile: Vpn_providers is a deduplicated array of all of the VPN operators that the user has used. Vpn_primary_provider includes the most frequently used VPN operators, indicating the top VPN preference for the given user. Vpn_tunnel_operatory_diversity provides a count of distinct VPN operators. This provides flagging for users who rotate VPNs.
Tunnel Type Breadth: Vpn_tunnel_type_diversity provides a count of distinct tunnel types observed as VPNs can coexist with other tunnel types such as proxies. Vpn_tunnel_types consists of a full array of all tunnel types observed for a given user.
These metrics help to formulate a known VPN profile for each given user. A user’s historical VPN data can be utilized to check for deviations. An example of this is if a user typically uses a certain VPN provider suddenly uses a myriad of new ones, that would appear unusual. With this, VPN traffic can be appropriately distinguished between for accurate detections.
Event-Specific Section-90 Day Baseline (Detection Specific Event Types)
This section of the baseline builder serves to provide detection specific features for various rules. The Skeleton Key Bypass rule takes into account policy changes and mfa enrollments through the mean/stddev calculations of both of these fields on an hourly basis. The SWA Bulk Credential Extraction rule takes the mean/stddev hourly SWA user authentication stats for formulating detections. The SWA Bulk Credential Extraction rule and SWA Off Hours rule utilize the mean/stddev and temporal ratios for membership changes.
Okta Skeleton Key Bypass Features
The Okta Skeleton Key Bypass section functions through the use of two primary CTEs checking for policy changes and MFA enrollments.
For policy changes, the policy hourly CTE allows for aggregation of admin policy modification activity into hourly buckets. This tracks two distinct counts per hour consisting of total policy changes and security weakenings. This activity can be indicative of intentional reduction of authentication security for malicious purposes. The policy_stats CTE provides the computation of the 90 day baseline from the hourly buckets including total volume, active days, and the mean and standard deviation of both policy changes and security weakenings per hour. This mean and standard deviation pair is later used by the Skeleton Key z-score query to compare against for detections.
For MFA enrollments, the enrollment hourly CTE captures hourly MFA activation events while distinguishing between self-enrollments and admin-on-behalf-of enrollment. The distinction is made by checking if the actor’s email differs from the target’s. Distinct users targeted per hour are also taken into account. This is later consolidated into the 90 day baseline consisting of total enrollments, active days, mean/stddev for environments, admin enrollments, and unique targets per hours. This aids in the Skeleton Key detections function as it can reference the admin enrollment metrics. Scenarios in which an admin enrolls MFA factors for a plethora of users within a short period could be indicative of Skeleton Key injection as the attack involves an attacker configuring a backdoor authenticator on accounts they plan to compromise.
Okta SWA Bulk Access Features
The Okta SWA Bulk Access section highlights indicators of excessive access of applications through a Secure Web Application.
The swa_access_hourly CTE identifies Secure Web Authentication SSO events and tracks four distinct dimensions: raw event volume, app diversity (apps accessed), country diversity, and IP diversity. Spikes in geographic and network diversity counts could hint at credential replay from multiple locations simultaneously which could ring suspicions.
The swa_known_sources CTE notes every distinct IP address and user agent used by a user within the past 90 days and stores them within an allowlist. Storing this allowlist within the lookup table is integral to allow the detection to flag any activity from unrecognized sources.
The swa_access_stats CTE takes the 90 day baseline from the hourly buckets for all four hourly dimensions. These three CTEs work together to aid in detections identifying diversity spikes and novelty IPs/User Agents outside of the established baseline.
Okta SWA Off Hours Features
The Okta SWA Off Hours section tracks events involving SWA credential modifications on behalf of another user. This event type is both rare and central to SWA credential extraction attacks, which is why temporal features here are vital.
The extraction_hourly CTE aggregates events per user per hour for three dimensions, raw extraction volume, victim diversity, and country diversity. The extraction_hour_activity, user_active_hour_slots, extraction_hourly_slot_classified CTEs work together to build a per-user schedule profile. These CTEs identify the number of distinct days the user had activity in each time slot regardless of timezone. This is then filtered to slots with activity on 3 or more distinct days to establish the hours of the week that are part of the user’s typical pattern which is then added to an array. From this, each individual hour is labeled as either being within or outside of the user’s prior established active slots. A mean and standard deviation of inactive time slots is computed across all hourly observations. Allowing the baseline to capture a user’s historical temporal data is key so the z-score detection can alert when a user spikes in activity outside of typical hours.
Okta AD Baseline 90d
This baseline builder builds a 90 day baseline for Okta Active Directory authentication patterns with particular focus on the user.authentication.auth_via_AD_agent event. Since this query works with events that bridge Active Directory with Okta, it needs a distinguished baseline separate from the general Okta baseline builder.
Through the scalar features CTE, this query stores per-user statistical metrics (mean, stddev) for hourly authentication volume, IP diversity, country diversity, city diversity, and device diversity. This helps to pinpoint the user’s most common authentication metrics.
The ad_agent_hourly CTE aggregates the same events into hourly buckets across five dimensions: event volume, IP diversity, country diversity, city diversity, and device fingerprint diversity. Following this, the ad_agent_stats CTE computes the mean and standard deviation for the individual dimensions within the hourly buckets. From this, the statistical baseline is produced which is then utilized by the z-score query for detections.
Z Score Queries
The z-score queries formulate the second phase of the behavioral detection pipeline. These z-score queries function by running on a schedule against the last 7 days of raw Okta logs, and joins that recent activity against the pre-computed baseline from the lookup table. Following this, z -scores are computed to determine if the user’s recent behavior is statistically anomalous given their own 90-day baseline history.
Across all queries, the pattern is consistent with recent activity aggregated into hourly buckets, summary statistics being generated (average or max per hour), and z-scores are computed from the following formula: (recent_value - baseline_mean) / baseline_stddev. T The denominator has a NULLIF guard to account for division-by-zero errors for users with a baseline standard deviation of zero (which could hint to consistent historical behavior). If z-scores exceed thresholds defined within detections, then anomaly flags are set. From this, a composite anomaly_severity_score is computed through the sum of positive z -scores which are weighted differently per dimension on the basis of signal strength, supporting priority ordering of results.
Query | Z-Score | Threshold | Combined Logic |
AD Agent Z-Score | z_score_volume | > 3 | Must exceed volume threshold AND at least one of IP or country diversity threshold |
z_score_ip_diversity | > 2 | ||
z_score_country_diversity | > 2 | ||
z_score_city_diversity | context only | Computed but not used for gating | |
z_score_device_diversity | context only | Computed but not used for gating | |
Skeleton Key Bypass | z_score_security_weakenings | > 2 | Either flag independently triggers is_anomalous |
z_score_admin_enrollments | > 3 | ||
z_score_policy_changes | > 3 | Context only — not part of overall anomaly flag | |
z_score_enrollments | > 3 | Context only | |
z_score_targets | context only | Computed but not used for gating | |
SWA Bulk Access | z_score_swa_volume | > 3 | Any single flag independently triggers is_anomalous |
z_score_app_diversity | > 3 | ||
z_score_extraction_volume | > 3 | ||
z_score_victim_diversity | > 2 | Lower threshold — victim targeting is higher signal | |
z_score_swa_country_diversity | context only | Computed but not used for gating | |
SWA Off-Hours | z_score_inactive_slot_ratio | > 3 | Single z-score; measures ratio of activity in historically inactive hour slots |
Cold Start Queries
The baseline has a requirement of a minimum accumulation period before it is able to produce output that is statistically significant. For these reasons, new users and accounts may fall under the radar with no baseline row available for them. This issue is addressed with cold start handling for these kinds of users, mitigating blind spots and improving the coverage in the baseline table. These cold start queries have absolute threshold checks that fire independently of any z-score calculation. Checking for behaviors that appear anomalous in excess on their own is the primary way that these cold start queries function.
Query | Cold Start Flag | Condition | Rationale |
|---|---|---|---|
AD Agent Z-Score | is_cold_start_anomal y | No baseline row AND recent_max_ip_diver sity_per_hour >=3 | 3+ IPs in one hour is inherently suspicious for AD Agent auth regardless of history |
Skeleton Key Bypass | is_first_time_security weakening | recent_total_weakeni ngs > 0 AND baseline weakenings = NULL or 0 | Any security weakening with no prior history is immediately high-signal |
Skeleton Key Bypass | is_first_time_admin_ enrollment | recent_total_admin_e nrollments > 0 AND baseline admin enrollments = NULL or 0 | Enrolling MFA for other users with no prior history of doing so warrants immediate scrutiny |
SWA Bulk Access | is_first_time_bulk_s wa_access | Baseline SWA events < 3 AND recent_total_swa_eve nts >= 10 | 10-event floor suppresses noise from occasional SWA use |
SWA Bulk Access | is_first_time_credenti al_extraction | Baseline extractions < 3 AND recent_total_extractio ns >=5 | Lower floor (5) reflects that any extraction activity is higher severity |
SWA Off-Hours | is_cold_start | active_utc_hour_slots IS NULL AND recent_total_credenti al_access >=3 | Cannot determine if hours are normal without a slot profile; 3-event floor prevents single-event noise |
Sample Scenarios
The following sample scenarios provide a look into an example of anomalous activity through the use of simulated users and logs. With this, you can visualize an attack timeline from start to finish as well as their respective z -scores and classifications.
$Z$Score Scenario
Summary
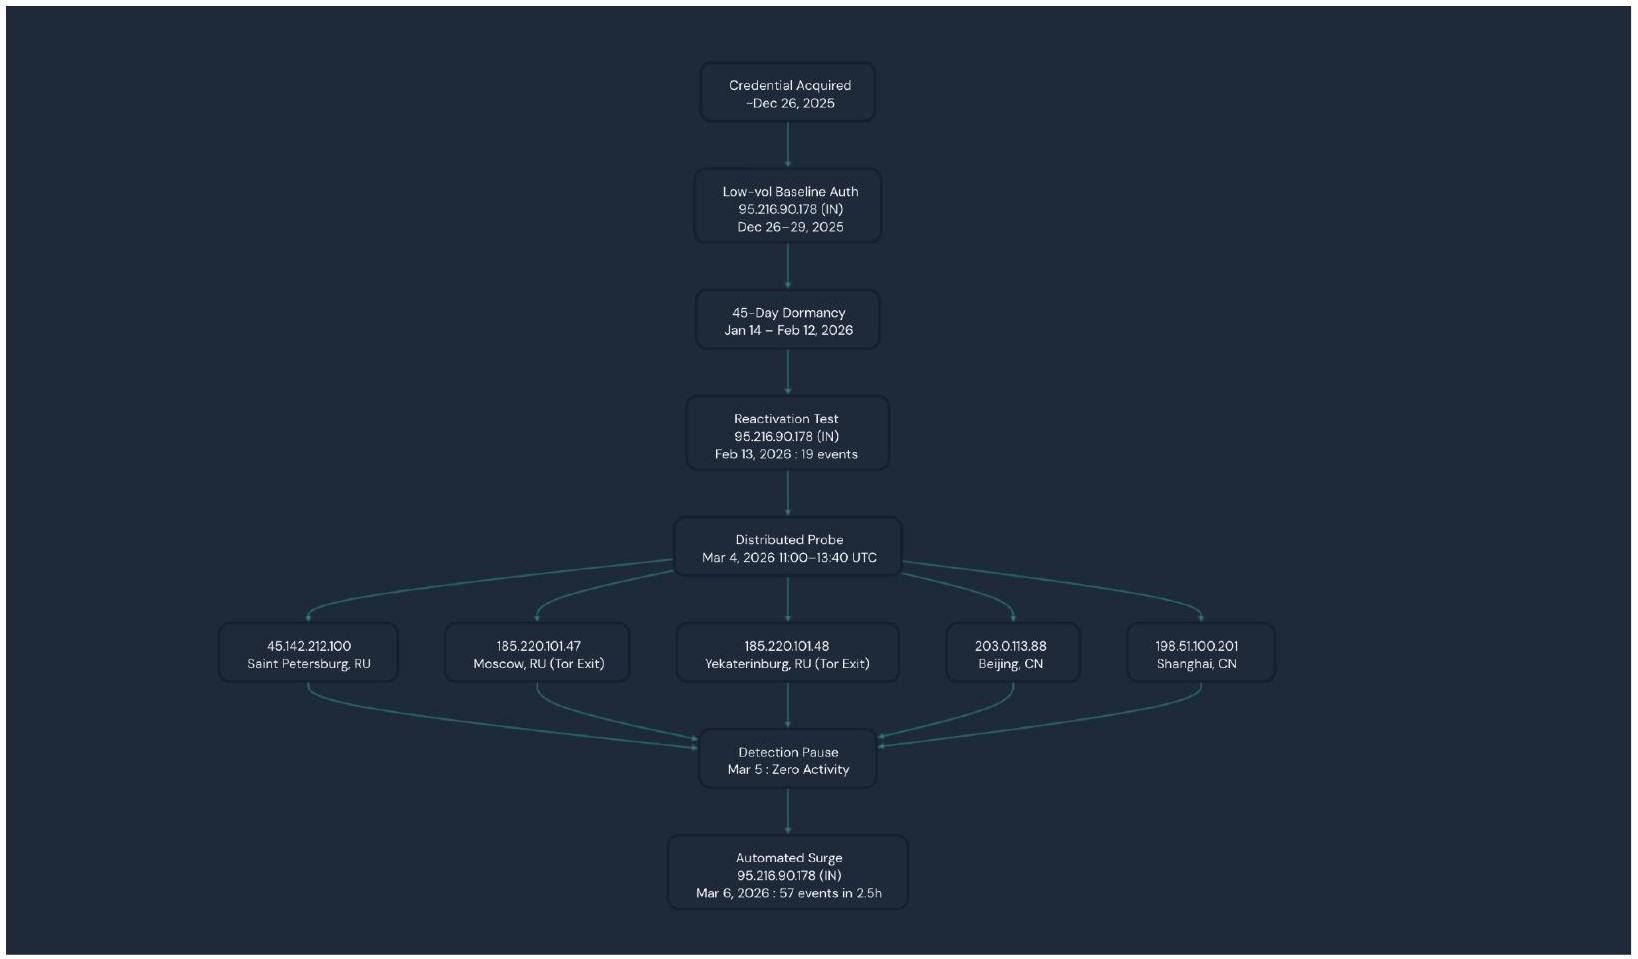
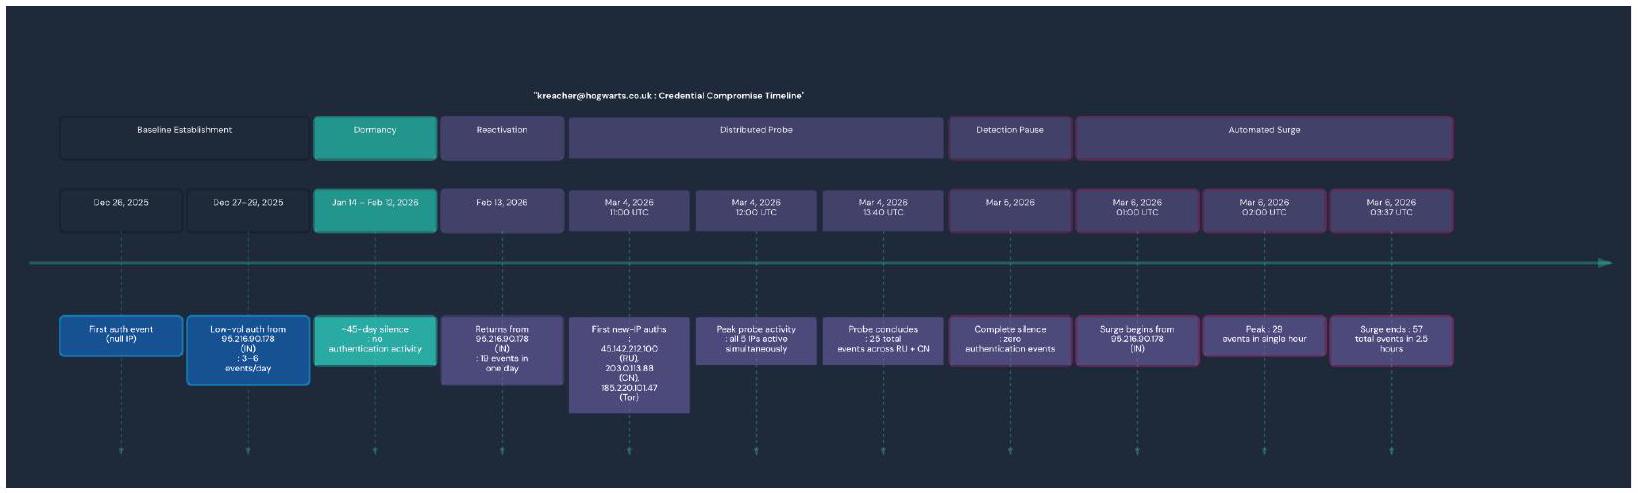
In this scenario we have a user named kreacher@hogwarts.co.uk who built an initial quiet single-IP authentication baseline from an IP based out of India 95[.]216[.]90[.]178 between the dates of December 26, 2025 and February 13, 2026. Kreacher then went dormant for about 45 days before returning with a distributed multi-county probe on March 4, 2026 with 5 simultaneous IPs from Russia and China including two confirmed Tor exit nodes. This was then followed by a single day of silence and then a 57 event automated burst from the original India IP on March 6, 2026. This pattern was identified and classified as Risky and showed signs consistent with a staged credential compromise and validation sequence.
Risk Classification
This stream of events was classified as Risky. This classification was assigned due to the simultaneous authentications from geographically impossible multi-country infrastructure within a short time period including Tor exit nodes, staged behavioral escalation, and automated burst activity. This pattern is on par with MITRE ATT&CK T1078 - Valid Accounts and T1090.003 -Multi-hop Proxy (Tor) TTPs.
Z Scoring Metrics
The Z-Score Analysis window This z -score analysis window is within the time frame of the past 7 days as to compare with the 90 day baseline to detect potentially anomalous behavior.
Window | Dates | Purpose |
|---|---|---|
Baseline | Dec 26, 2025 → Feb 26, 2026 | 90-day behavioral baseline (~days -97 to -7 from last data point) |
Recent | Feb 27, 2026 → Mar 6, 2026 | 7-day “current” window for anomaly comparison |
Baseline Event Contributions
Here we can visualize the initial 90 day baseline for Kreacher. Nothing here is overtly alarming and reads as normal activity.
Date | Events | Unique IPs | Countries | Notes |
|---|---|---|---|---|
Dec 26, 2025 | 3 | 0 (null) | - | First appearance, no IP captured |
Dec 27, 2025 | 3 | 1 ( 95.216.90.178 ) | IN | India baseline begins |
Dec 28, 2025 | 6 | 1 ( 95.216.90.178 ) | IN | |
Dec 29, 2025 | 3 | 1 ( 95.216.90.178 ) | IN | |
(quiet period) | - | - | - | No events until Jan 14 |
Jan 14, 2026 | ~ 4-6 | 1 | IN | Last baseline active day |
(45-day dormancy) | - | - | - | Jan $14 \rightarrow$ Feb 12 : zero events |
Feb 13, 2026 | 19 | 1 ( 95.216.90.178 ) | IN | Reactivation still in baseline window |
Baseline Summary:
49 total events across 11 active days
All events from a single IP (95[.]216[.]90[.]178, India)
All events from a single country (IN)
Mean events per active day: $\sim 4.5$
Mean IP diversity per day: $\sim 1.0$
Mean country diversity per day: $\sim 1.0$
Recent Window Event Contributions
The activities within the z -score detection window appear to be overtly anomalous. We can see an influx of new IPs from Russia and China within a short period of time. This affected the z-score the most. Then it seems there is a day of now activity to try and cover tracks. Following this, we have a surge of events from the initial India IP.
Date | Events | Unique IPs | Countries | Z-Score Contribution |
|---|---|---|---|---|
Mar 4, 2026 | 25 | 5 (RU + CN IPs incl. 185[.]220[.]101[.]4 7, 185[.]220[.]101[.]4 8 Tor exits) | RU, CN | Primary anomaly driver: new geos, max IP diversity |
Mar 5, 2026 | 0 | 0 | - | Silent gap — counted in window avg but contributes zero |
Mar 6, 2026 | 57 | 1 (95[.]216[.]90[.]1 78) | IN | Volume surge driver: highest single-day count |
Recent Window Summary (avg over active days only)
Avg events per active day: $41=(25+57) / 2$
Avg IP diversity per active day: $3.0=(5+1) / 2$
Avg country diversity per active day: $1.5=(2+1) / 2$
Z-Score Calculation Per Dimension
Here you can really start to visualize the discrepancies between Kreacher’s baseline activity, and the recent 7 days of anomalous activity. With calculations for mean and standard deviation present alongside the recent values, a z score can be calculated with the following formula $\mathbf{z}= (\mathbf{x}-\boldsymbol{\mu}) / \boldsymbol{\sigma}$. With z-score calculations for each given dimension, it is simple to identify the sever outliers per event, IP, and country.
Dimension | Baseline Mean( $\mu$ ) | Baseline $\boldsymbol{\operatorname { S t d D e v }} \boldsymbol{(} \boldsymbol{\sigma} \boldsymbol{)}$ | Recent Value (x) | Z-Score | Classificatio n |
|---|---|---|---|---|---|
Events/active day | $\sim 4.5$ | ~4.96 | 41.0 | +7.36 | Extreme outlier $7.36 \sigma$ above normal |
IP diversity/acti ve day | $\sim 1.0$ | $\sim 0.37$ | 3.0 | +5.39 | Severe 5.39σ above normal |
Country diversity/acti ve day | $\sim 1.0$ | $\sim 0.30$ | 1.5 | +1.69 | Meaningful $-1.69 \sigma$ above normal |
Anomaly Classification Logic
For the total severity score, only the sum of positive z -scores is taken (no negative deviations included). The following SQL query is utilized to determine if the ANOMALOUS label is assigned.
In this instance, the z score volume and z score IP diversity was far beyond the threshold, so it was marked as ANOMALOUS.
Summary: Each Events Contributions to the Z-Score
March 4 ( 25 events, 5 IPs, RU +CN ) → Drove both the IP diversity z-score ( +5.39 ) and the country diversity z -score $(+1.69)$. This rapid geographic expansion defined the anomaly pattern.
March 5 ( 0 events) → Diluted the recent averages (bringing avg events/day down slightly), however it did not cancel the anomaly. The threshold was far too high to water down with a single zero day.
March 6 ( 57 events, 1 IP, IN) → This is the primary driver of the volume z-score (+7.36). The 57 -event surge pushed the per-active-day average to 41 . This pushes way past the baseline’s mean of $\sim 4.5$.
Timelines
These timelines serve to paint a picture of Kreacher’s activity over time. You can identify the anomalous spikes and grasp how
Recap
Single-origin baseline then geographic explosion: For the entire baseline period (Dec 26, 2025 - Feb 13, 2026), every authenticated session came from exactly one IP 95[.]216[.]90[.]178 (India). On March 4, 2026, five brand-new IPs from RU and CN appeared simultaneously. This shift from 1 country to 2,1 city to 5 , in a single 3 -hour window raises alarms as this is impossible.
Tor exit node authentication: 185[.]220[.]101[.]47 (Moscow) and 185[.]220[.]101[.]48 (Yekaterinburg) are known Tor exit nodes. They authenticated at 11:00, 12:00, and 13:00 UTC on March 4 with 9 events across Tor alone. Tor is exclusively used to hide the true origin of a connection making this activity ring suspicions.
Geographically impossible simultaneity: At 12:00 UTC on March 4, kreacher authenticated from Beijing, Saint Petersburg, Yekaterinburg, Moscow, and Shanghai in the same clock hour. No single person can be in 5 cities across 2 countries simultaneously which makes this activity overtly anomalous.
Deliberate one-day pause then automated surge: March 5 had zero activity which served as a silent gap between the probe and the next phase. On March 6, 57 events fired from the “trusted” India IP across just 2.5 hours (01:00-03:37 UTC), peaking at 29 events in a single hour. This is far more than kreacher had ever produced in a full day.
Conclusion
This simulated detection showcased a staged, multi-phase credential abuse series of events that involved Tor exit nodes and geographically impossible simultaneous authentication. In a real environment, this activity would certainly raise alarms. The z -score calculation brings attention to this
Cold Start Scenario
Summary
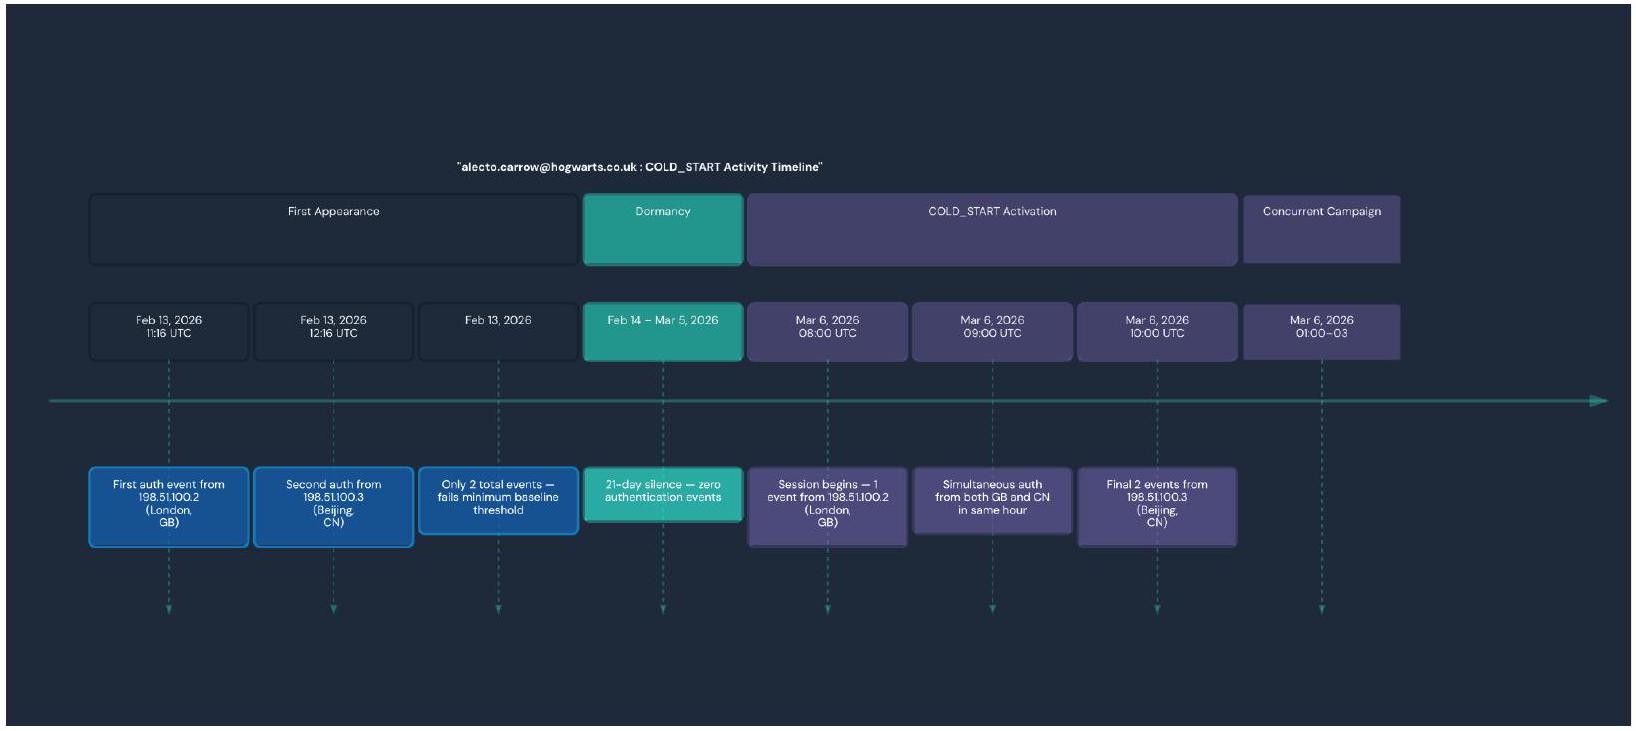
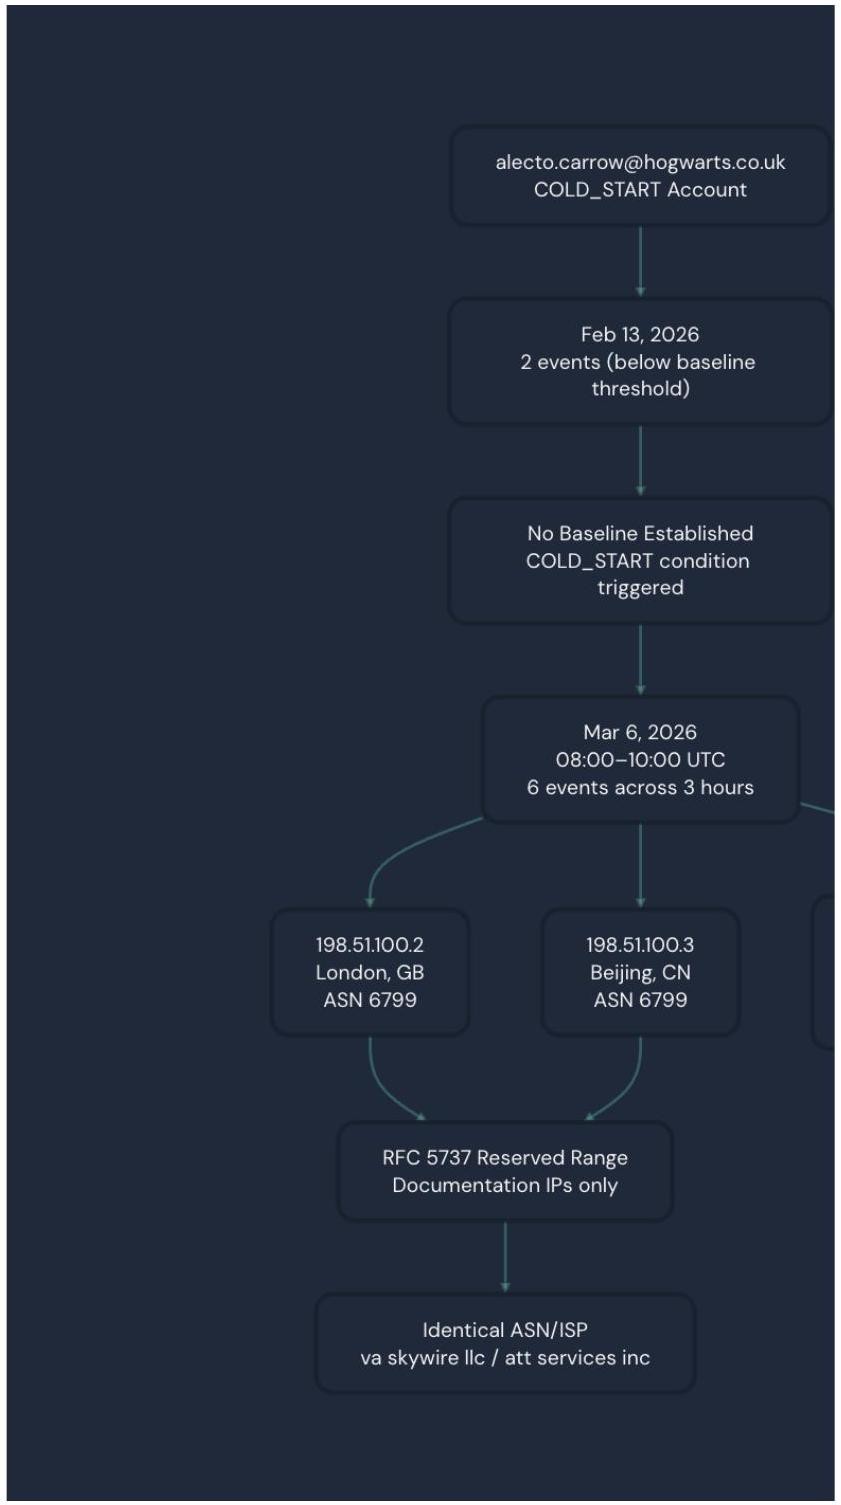
In this scenario we have a user alecto.carrow@hogwarts.co.uk who is initiating a COLD_START anomaly. This involves a newly observed account with no qualifying behavioral baseline. This user emerged with events on March 6, 2026 with 6 successful user.authentication.auth_via_AD_agent events across two geographically impossible locations (London and Beijing) within a 3 hour window. This series of events was classified as Risky justifiably so.
Risk Classification
This activity was classified as risky due to the geographically impossible simultaneous multi-country authentication as well as RFC 5737 infrastructure anomalies. This activity falls in line with the MITRE ATT&CK T1078 - Valid Accounts pattern with T1090 - Proxy characteristics.
Risk Indicators
COLD_START: No qualifying baseline exists for this user. Alecto only had 2 events on Feb 13, 2026 which is below the minimum 5 event threshold that is required to build a statistical baseline. This led to the account appearing with zero behavioral history when it generated recent multi-country activity. This activity matched the COLD_START detection condition (b.user_email is NULL and recent_max_ip_div >=2).
Geographic impossibility on March 6: at 9:00 UTC on March 6, the account simultaneously authenticated from 198[.]51[.]100[.2] (London, GB) and 198[.]51[.]100[.]3 (Beijing, CN) within the same clock hour. This is physically impossible for one single user so this raises immediate red flags.
Timeline
Conclusion
This pattern of activity from the user (zero history to multi-authentication from geographically impossible locations) is a high-confidence indicator of credential compromise.
Panther Investigation
Log Generation with Rehtnap
To conduct a thorough demonstration of the baselines, I utilized a tool called Rehtnap for fake log generation within Panther. The generation of realistic log data with this tool can be helpful for demonstrations and detection creation for log types that may not be initially present. Further, this tool can also be used to simulate specific attack scenarios and patterns.
In terms of $\log$ generation, it is imperative to craft out the detection scenario in your mind. You will need to determine the types of logs that you are looking for that will be suitable for the scenario you are simulating. Keep in mind factors like the baseline, attack patterns, and supporting context. Some questions to ask yourself includes the following: -What event types do I need? -What’s the anomalous pattern? -How many logs do I need?
Webhook Configuration
A webhook needs to be configured within Panther to allow you to export the logs that you generate.
Navigate to Configure $>$ Log Sources
Click Create New
Choose HTTP as the source type
Configure -Name: [Log Source Name] -Log Type: [e.g. Okta.SystemLog] -Custom Header Name: [Header Name of your Choice] -Shared Secret: Generate a secure secret
Copy Webhook URL https://logs.threat-research.runpanther.net/http/YOUR-WEBHOOK-ID
Save to your environment
Create Log Generator (Python)
For each log type it is vital to ensure the log structure is consistent with the formatting of the log type that you wish to generate. This log structure should be used to create the Python log generator. In addition, the python generator script should have the following features to ensure success:
Here is a sample python template to generate the logs of your choosing.
Create Send Script (Python)
A sender script is also necessary as it uses the post_data_to_panther function. This Python script serves to send the pre-generated logs to Panther via HTTP webhook.
Create Wrapper Script (Bash)
In conjunction with this, a Bash wrapper script is also needed. This script needs to be configured with your respective webhook url, webhook header name, and Panther secret.
Once both scripts are configured make sure to make them executable:
None chmod +x send_detection_to_panther.sh
Now you can run the send script ./send_detection_to_panther.sh. The output should look something like this
After running the script, wait a few minutes and query the Data Explorer with a SQL query ensuring the logs were loaded in correctly. A sample SQL query should be provided and can look as follows:
Iterating these scripts allows you to generate the logs of your choosing. These logs will aid you in demonstrating and testing a variety of use cases to simulate anomalous activities.
Conclusion
Baseline detections are a step in the right direction as adversaries become increasingly creative. Static detections are severely limited to only detecting attacks that match known bad patterns such as hardcoded thresholds and specific events. Evolved attackers are sophisticated and have adapted to perform attacks while blending into normal activities by avoiding the static events that these detections depend on to function. Closing the gap with baselines is imperative as it combats evasion techniques that skilled attackers may try to use. For example, an attacker replaying a stolen AD agent token across multiple locations will not be detected by a static rule that only detects “more than 50 logins is bad”. On the other hand, with baselines that activity stands out against the user’s normal activity of authenticating from a single IP for more than 90 consecutive days. Another example is an admin that quietly weakens security policies twice an hour goes undetected by a static detection that only looks for disablement events. A baseline would catch this as it notices the users’ historical rate as being two changes a week. Building individual profiles on users with baselines is vital as it allows us insight into threats that are calibrated to stay under or avoid rigid static thresholds. Baselines catch behavioral anomalies that static rules cannot, this applies to attacks abusing legitimate accounts and credentials that may appear normal in isolation. Establishing a profile for each individual user helps to determine out of character behavior, which makes baselines the stronger choice against threats such as credential theft, insider abuse, and slow moving attackers who purposefully stay under fixed thresholds. As threat actors evolve, it is imperative that we stay ahead of the curve. Baseline behavioral detections are a step in the right direction as we work to combat evolving threats.
See it in action
Most AI closes the alert. Panther closes the loop.

Share:
Threat Research
RESOURCES