How to Create a Code-Based Detection
Remy
Kullberg
Dec 12, 2023
TL;DR Detection-as-code increases the efficiency, effectiveness, and collaboration of security teams. Use Python to create detections and manage them using the command line interface; or use a selection of non-code tools to create and manage detections with Panther, and still benefit from detection-as-code.
Soon you'll learn that creating a code-based detection is remarkably straightforward. You'll understand how to manage coded detections using the command line interface (CLI) and version control, both of which are hallmarks of detection-as-code.
But this blog also explains how teams with diverse skill sets can benefit from detection-as-code without knowing how to code or use the CLI. This enables cross-functional teamsAidevelopers, security practitioners, leadership, and operationsAito have the tools to collaborate on detections and develop more effective security coverage.
Let's start with the basics.
The benefits of detection-as-code (DaC)
Detection-as-code is the practice of creating detection rules using programming languages, such as Python, and managing them through version control systems like GitHub. This approach aligns with other Aoas-code' methodologiesAisuch as infrastructure-as-codeAiwhich aim to make processes consistent, scalable, portable, and auditable. In the field of information security, DaC extends these advantages by injecting flexibility and customizability into Security Information and Event Management (SIEM), effectively addressing the common challenges faced by practitioners: ease of use, accuracy, and comprehensive coverage.
Here are the key benefits of detection-as-code:
Faster time to production. Managing detections as code in version control simplifies making changes and enables collaboration through peer review, empowering teams to swiftly respond to new threats.
Increased operational efficiency. Deploying code-based detections can be automated with CI/CD pipelines, boosting consistency, control, and operational efficiency.
Greater security coverage. Using an expressive programming language with access to out-of-the-box tools and libraries enables you to tailor detections and cover security gaps.
Increased alert signal-to-noise. Detections trigger alerts, so customizing detections to be specific reduces false positives, thereby decreasing unnecessary noise and alert fatigue. Practitioners can ensure detection efficacy with unit tests.
Reduced mean time to detection and resolve (MTTD/R). Tailored and correlated detections provide accurate and informative alerts, helping teams prioritize urgent security issues.
Scalable threat detection. Coded detections are reusable across projects and adaptable to evolving data sources, at cloud-scale.
Enhanced visibility and auditing. Code-based detections allow for thorough testing and auditing. Anyone with access to the version control system can understand the detection landscape, review changes, and conduct audits.
Syntax of a code-based detection
In Panther, a code-based detection is created using two files: a Python file (rule.py) that contains the detection logic and a YAML file (rule.yml) that contains the metadata for the detection. Here's an example of the basic rule structure from the Panther docs:
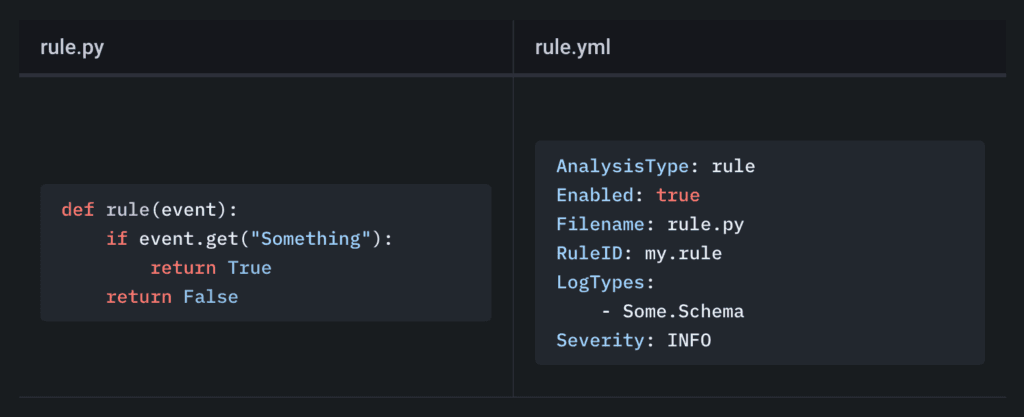
These two files make up a single detection rule:
The Python file defines the logic that detects security issues. The detection logic processes the normalized log data. Anytime the logic detects an issue, it triggers an alert to notify you. In other words, practitioners use Python data types (like strings and numbers) to compare, evaluate, or match with data in the normalized logs to detect security violations.
The YAML file defines how the detection rule is identified and managed through key-value pairs. This includes enabling or disabling rules, setting the severity of the detection, and defining the human-readable information that goes in the alert.
Now let's get into the syntax.
To create a detection rule in Python, you'll incorporate these basic elements:
Invoke the rule() function to define a new detection rule and target the event, the normalized log data.
Determine the condition for the detection with an if statement. Usually the condition will target information within the normalized log data.
Trigger an alert if the rule() returns true. If the rule() function returns false, nothing happens.
You have many options for information to include in the YAML metadata file, however you must include six pieces of required information (as shown in the previous image), listed in any order:
AnalysisType: Whether this detection is a rule that analyzes logs in real-time, or another type of analysis like a policy or scheduled rule.
Enabled: A true or false value determining whether or not the detection is in use.
Filename: The file path to the python detection logic.
RuleID: The unique identifier of the detection.
LogTypes: The list of log sources to apply this detection to.
Severity: What severity this detection has, either Info, Low, Medium, High, or Critical. This enables teams to prioritize alerts.
Convention is for the name of the Python detection logic and the YAML metadata files to match.
A detection for an AWS S3 access error
Now that you're familiar with the basics, let's look at a more complex example, one of the 500+ out-of-the-box detections that Panther offers.
Here's the Python detection logic:
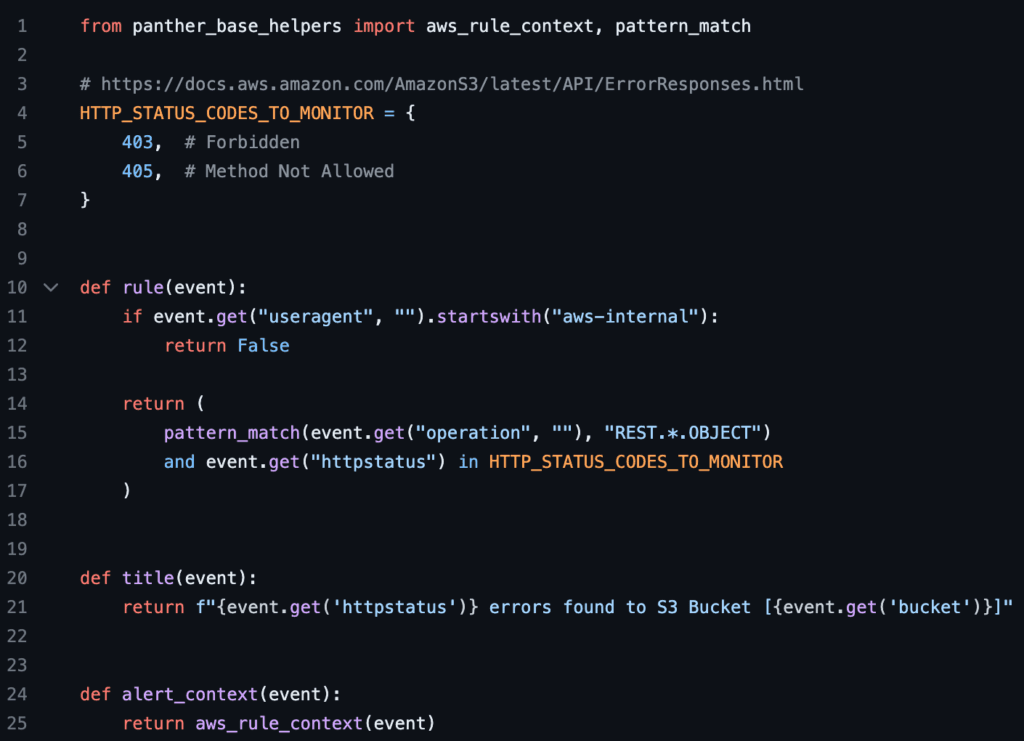
This Python rule detects an access error for an AWS S3 bucket. Notice the new elements in comparison to the basic rule structure:
(Line 1) Imported helper functions at the top of the file. This detection imports two functions from the panther_base_helpers library, a toolset provided by Panther to perform routine tasks. For example, the pattern_match function matches input to Unix filenames.
(Line 4) Python variables. A variable called HTTP_STATUS_CODES_TO_MONITOR contains a list of the relevant HTTP status codes that the logic needs to detect.
(Line 14) Flexible expressions. Instead of explicitly returning true from the rule() function, Python is flexible enough to return an expression that ultimately evaluates to true or false. In this case, the expression (starting with pattern_match(A)) looks in the logs for pattern matches with the HTTP status codes.
(Line 20) Built-in Python functionality.The title() function dynamically sets the generated alert's title with information from the logs.
(Line 24) Dynamic information added to alerts. The alert_context() function adds additional information to the generated alert. In this case, it's invoking the helper function aws_rule_context(), which gathers AWS-specific values to add to the alert, like the event's name and source.
This is just one example of how Python enables you to customize detection logic: you can develop your own libraries of helper functions, or make use of many Panther-provided tools; you can use Python variables to represent any changing data that needs to plug into the detection logic; you can leverage Python's flexibility to structure your logic to be both effective and expressive; or you can add dynamic information to your alerts.
Next, let's take a look at the corresponding metadata file written with YAML:
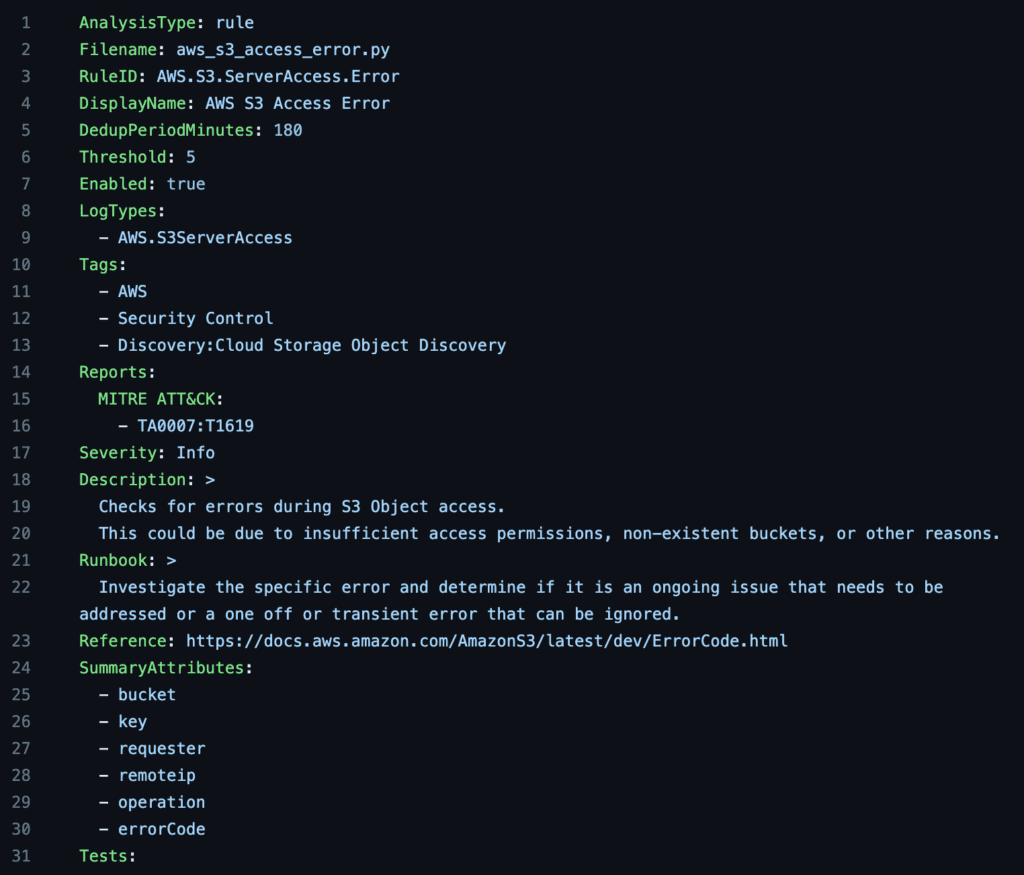
The YAML metadata file for an AWS S3 access error defines how the detection rule is identified and managed. Crucially, this file determines when an alert should be triggered, and what information should go in it.
In addition to the six required key-value pairs, there are ten optional fields. For brevity, let's review just a few of these fields and how they impact workflows. You can read about the others in the Panther rule specification reference.
(Line 5) DedupPeriodMinutes: The set time to perform deduplication by grouping events that occur during the same time so that only one alert is produced.
(Line 14) Reports: The association with adversarial techniques described by CIS, PCI DSS, and MITRE ATT@CK, by mapping the report names to specific adversarial techniques.
(Line 21) Runbook: Actions for security practitioners to carry out to address the alert.
(Line 31) Tests: Unit tests for this rule. In the previous image, the actual unit tests were omitted for brevity, so only the key is visible. Check out the original file to see the unit tests in detail.
These optional fields work to reduce alert noise and increase your efficiency by structuring all the relevant information so that you can understand, correlate, and prioritize alerts and eliminate threats.
The process of managing code-based detections
Let's step back now and take a look at the big-picture process of creating and managing code-based detections using the CLI. The very first step in this process is signing up for Panther and onboarding all of your log sources. From there, here's how you would manage code-based detections:
Start by copying the panther-analysis repo that contains all of Panther's out-of-box detections.
Customize the built-in Panther detections and disable irrelevant detections.
Configure your alert destinations to receive alerts in locations other than the Panther console. By default, alerts are dispatched by severity level.
Create custom detections in your preferred code editor and apply best practices to your Python logic.
Use pull requests (PRs) to add or change detections in the production branch of your version control system and to request peer review.
Write unit tests for your detections.
Incorporate detections into your CI/CD pipeline.
Comparing alternatives: Panther's Python vs Splunk's Search Processing Language (SPL)
SIEM solutions are increasingly offering detection-as-code to access the advantages of scalable, flexible, and customizable threat detection. But not all solutions use Python, or other widely known programming languages. To understand this, let's compare Panther with Splunk.
Splunk detections use Search Processing Language (SPL), their proprietary search language that is based on the Unix pipeline and Structured Query Language (SQL). With SPL, practitioners can query their security data lake and create code-based threat detection rules. Consider this SPL detection for access to AWS S3 from a new IP address:
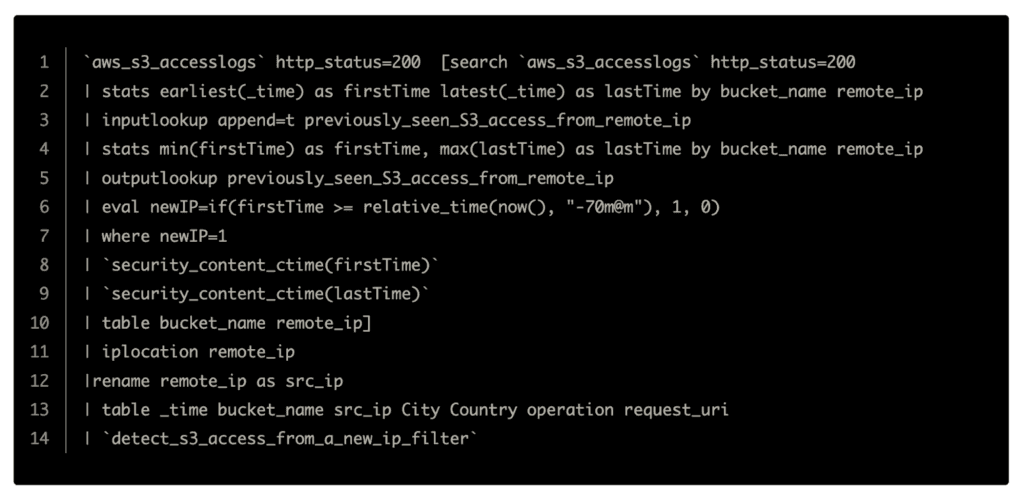
Similar to Panther, a YAML metadata file describes this detection. Departing from Panther, SPL is the search logic that processes the log data to detect threats. While evaluating whether Python or SPL is harder to understand at face value is entirely subjective, there are some core drawbacks to using a proprietary language:
SPL-specialized developers are required, and are harder to find than Python developers.
If training in either language is required, Python is a more versatile language to learn, more broadly applicable, and highly valued in security engineering.
More ways to create and customize detections
Panther offers more ways to create detections, enabling security teams to reap the benefits of detection-as-code without needing every team member to have programming experience.
Simple Detections builder
Practitioners can create, test, and deploy detections without code in the Panther Console using the Simple Detections builder. The Simple Detections builder provides a series of forms that allows practitioners to target log data and specific conditions that indicate a threat is present. Under the hood, these forms generate a YAML-based detection, which means Simple Detections retain the benefits of detections-as-code: expressiveness, testability, CI/CD integration, and reusability.
YAML detections
A markup language, YAML is known as a human-readable description language that structures data. A YAML detection looks like the YAML metadata file that you saw earlier in this blog, but it contains a few additional fields that describe detection logic, which forgoes the need for Python detection logic. YAML detections can be created in the Panther Console or in the CLI.
Panther-managed detections
Panther offers 500+ out-of-the-box detections for security teams to get value from their SIEM on day one. Panther manages the core logic and periodically releases updates. Practitioners can use these detections as is, or customize them in the Panther Console or using the CLI workflow.
More than real-time detection
Panther covers other use cases and ways to customize for detections. So far you've learned about analysis rules that detect threats in real-time. Panther also offers:
Scheduled rules. Detections that are run against at-rest data in the security data lake.
Rule filters. With inline filters, you can set a condition that must be met in order for the detection to process log data. This allows you to finely tune your detection rules.
Policies. Detections that alert on misconfigured cloud infrastructure.
Next steps
Get started with Panther's detection-as-code by requesting a demo.
Or, take a closer look at how Panther does detection-as-code:
Get familiar with onboarding by reading the quick start.
Take a closer look at the documentation on detections.
Learn from an industry peer: Understand how Cedar scales security and gains better visibility with Panther.
Recommended Resources


Ready for less noise
and more control?
See Panther in action. Book a demo today.
